
Last updated on May 3, 2022
How to Improve Your Marketing Analytics with a 360-View of Your Customer
By Josh Goldner
In this blog, we will discuss why integrating your Google Analytics with the rest of your company data is beneficial for your marketing analytics, provide examples of the different types of insights you can gain for your marketing needs, and share tips on how you can get started.
Most organizations today rely on Google Analytics to get an accurate picture of their website traffic. While the data offered in this tool is extremely valuable for marketing analytics, it has the potential to bring so much more value and business context when combined with your other data sources. What if you could understand more than just who, what, when, where, and why someone visited your company’s website and actually dig into how that impacts your marketing, sales, customer service, and experience—and ultimately your business?Why You Should Combine Your Google Analytics Data with Your Company Data
While Google Analytics on its own is a great tool, it lives in a silo—disconnected from your other data including your ERP data and from tools like Marketo, Salesforce, Google Ads, LinkedIn etc. —making it difficult to get the full picture around your marketing efforts.Combining your Google Analytics data with the rest of your company data enables you to understand the full picture of how customers engage with your business, and also why.With a more complete view of your customer data and their experience with your brand, you can gain deeper insights that will allow you to make better decisions, driving growth, increasing revenue, innovating new products or services, and much more.
New Insights You Can Gain with Integrated Marketing Analytics
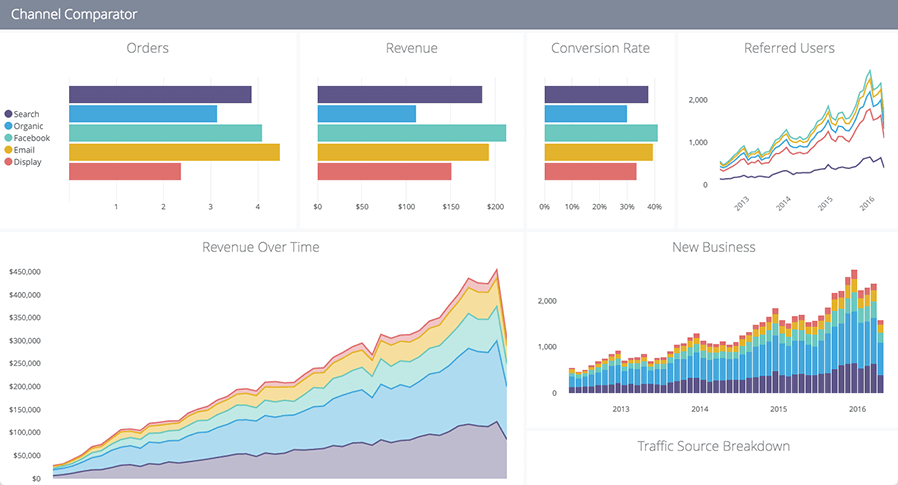
There are all sorts of new insights you can gain by integrating your company data for marketing analytics—everything from a holistic view of your customer and their interaction with your brand to evaluating specific marketing campaigns and diving deep into their effectiveness, or lack thereof.Gain a 360-View of Your Customers
Gain a 360-view of your customers in a single platform. Get an overview of your customers, including details around every touchpoint in their journey to becoming a customer. A 360-view of your customer answers questions such as:- Where are my customers coming from? How many were converted?
- What were my customers looking for? Did they purchase or take the next steps?
- What keeps a customer engaged, and when do I need to reach out?
- Are there things I can do pre-emptively to anticipate customers’ needs?
Measure Sales Performance and Improve Sales Forecasting
Measure sales performance and improve sales forecasting by analyzing current and historical sales data alongside relevant web traffic and campaign performance. Tying marketing data to sales data allows you to answer questions such as:- Is it worth investing more in one channel versus another?
- What channels lead to stronger customer retention?
- Where are or aren’t conversions happening and why?
- What website interactions lead to an actual sale? Where do they detract from a sale?
- Am I interacting effectively and efficiently enough with existing customers to raise retention?

Understand Customer Behavior and Perform Customer Segmentation
Understand customer behavior and perform customer segmentation by identifying customer preferences and purchase patterns, and segmenting campaigns accordingly. These insights can help answer questions such as:- What drives customer retention?
- How do we maintain subscription user bases?
- What is the lifecycle of a cohort?
- How is lifetime value impacted, and where?
- Who is interacting with campaigns and when?
- What are customers searching for, and how does that compare to what you’re providing?
Evaluate Marketing Campaign Performance
Evaluate marketing campaign performance by tracking and measuring your campaigns alongside marketing activities. Doing so will allow you to answer questions such as:- Are leads converting to actual opportunities? Are opportunities converting to revenue?
- Which channel or campaign is to blame or praise for success or failure? Has it improved over time?
- Are my campaigns reaching the right people at the right time?
Best Practices to Integrate Your Google Analytics Data with the Rest of Your Data
The technology you use will dictate certain aspects of moving and combining your data, but the process remains the same across the board: Start by documenting your questions and data sources, get the data you want from Google Analytics into to a central data repository (like a data warehouse), integrate it with the rest of your data, and create meaningful visualizations and dashboards in your select business intelligence (BI) platform.Learn more about whether you need a data warehouse or about selecting a BI tool that fits with your data architecture.
Tip #1: Focus on the Questions that Matter and Identify Your Data Sources
Having all the data in your organization cleaned, prepped, and ready for action is something that takes time, and honestly, can be daunting to think about. It can be overwhelming to think about analyzing all your Google Analytics data, let alone pitting that data against sales, inventory, or any other data within your organization. Instead of trying to boil the ocean from the get-go, take time to understand what questions need to be answered and where you need to source the data to answer those questions.- Document the questions you want to answer that will help you better understand and improve your marketing efforts. Start with recurring questions that are time-consuming to answer, but also take the time to consider questions that aren’t often asked. Once you understand what you are trying to analyze and what common questions you are going through time-consuming manual efforts to answer, you can map out what data is needed to answer those questions.
- Map out your data sources. Is the rest of the data you need to answer your questions already in a central repository, or will you need to integrate additional data beyond Google Analytics data?
Tip #2: Get Your Google Analytics and All Your Other Data into A Central Data Repository
Trying to answer questions with data that is siloed is a lot like cooking a meal, but going to a different grocery store for each item in your recipe. It is both time-consuming and error-prone. Having your data in a centralized location—ideally conformed and transformed together—allows for questions to be asked and answered in an actionable and timely manner. Marketing teams will likely need to work with the IT department to integrate their Google Analytics data with the rest of their company data. These are the steps they can take:- If you have a data warehouse, find out if your Google Analytics data is being integrated into your data warehouse. If it’s not, start by identifying the Google Analytics data you want to move over and use integration tools provided by your cloud data warehouse—Google Cloud (GCP), AWS, Microsoft Azure—to export the data. Many tools, like Fivetran, have built-in connectors that allow you to quickly pull data out of Google Analytics as well. You could even go so far as to create a parallel tracking system that streams your data to both Google Analytics and your data warehouse.
- If you don’t have a data warehouse, getting the data out of the Google Analytics silo will still have a tremendous impact on your marketing analytics. Having it in a data repository, data lake, or just in a simple database alongside your other data allows you to still merge data from other parts of your organization to get a bigger and better understanding of how your marketing is impacting the bottom line. You can still use GCP’s (or other cloud providers) integrated tools or third-party tools like Fivetran to automate data extraction in a centralized location. Once your Google Analytics data is in a centralized location with your other data, much like above, you can start to see how all facets of your business are impacted by marketing.
Tip #3: Utilize a Good BI Platform
Now that you have integrated your Google Analytics data with the rest of your data—whether in a data warehouse or not—you need a way to visualize and analyze everything. Find out if your organization has a BI tool, and if so, what its capabilities are. If not, can you explore getting a BI tool for your needs?Learn more about selecting a BI tool for your business.
When visualizing your data in your BI tool, you should be able to relate the data without a bunch of inference or custom BI business logic. All of this should ideally be handled at the data warehouse level, ready to be consumed by your BI platform. However, if a data warehouse or centralized data repository isn’t an option, then having a solid BI platform that can still act as a data warehouse or central repository is your next best choice.- Most BI platforms, like Looker, allow you to integrate data from multiple locations and create business logic, production-level reusable code, and dashboards within the tool. Looker, for example, even has accelerators (Blocks) to help you ingest/visualize Google Analytics data with, or next to your existing data. As with the best practices above, having a way to integrate your data in an automated fashion will allow you to focus on analyzing the data, as opposed to having to infer, manually calculate, or miss opportunities within your data.
- A good BI platform (even in the absence of a data warehouse) will allow you to have the data in one place, automate reports and dashboards, analyze areas of focus, and alert you to metrics that need immediate attention. By not having to run these reports manually each time, you can focus most of your time and energy on gaining actionable insights as opposed to generating the data to answer a question that is no longer relevant.
Elevate Your Marketing Efforts with a 360-View of Your Customer
Integrating your Google Analytics data with your other company data is a critical step in improving your marketing analytics and drawing value from your data. It will provide a wider lens into all your marketing efforts and how they tie back to your customer interactions, allowing you to make adjustments, build relationships, and provide an excellent customer experience.Talk With a Data Analytics Expert
Key Takeaways
- Integrating Google Analytics with other company data offers a more complete view of customer interactions.
- Combining datasets enables deeper insights into marketing, sales, and customer service strategies.
- Integrated data allows for better measurement of marketing campaign effectiveness and sales performance.
- A 360-view of customers can help anticipate needs and improve customer experience.
- Data integration provides clearer insights into customer behavior and allows for targeted marketing strategies.
- Having a central data repository helps streamline analytics processes and reduces errors.
- Using a robust BI platform is essential for visualizing and analyzing integrated data effectively.
- The iterative process of data integration and analysis can uncover additional valuable insights over time.