A Comprehensive BI Tool Comparison for the Best Fit
By Kevin Lobo
Before selecting a business intelligence (BI) tool for your analytics needs, you need to understand how they work, how they differ, and the value they can bring to your business. This blog offers a detailed BI tool comparison to help you make an informed decision.
BI Tools in the Context of the Entire Data Architecture
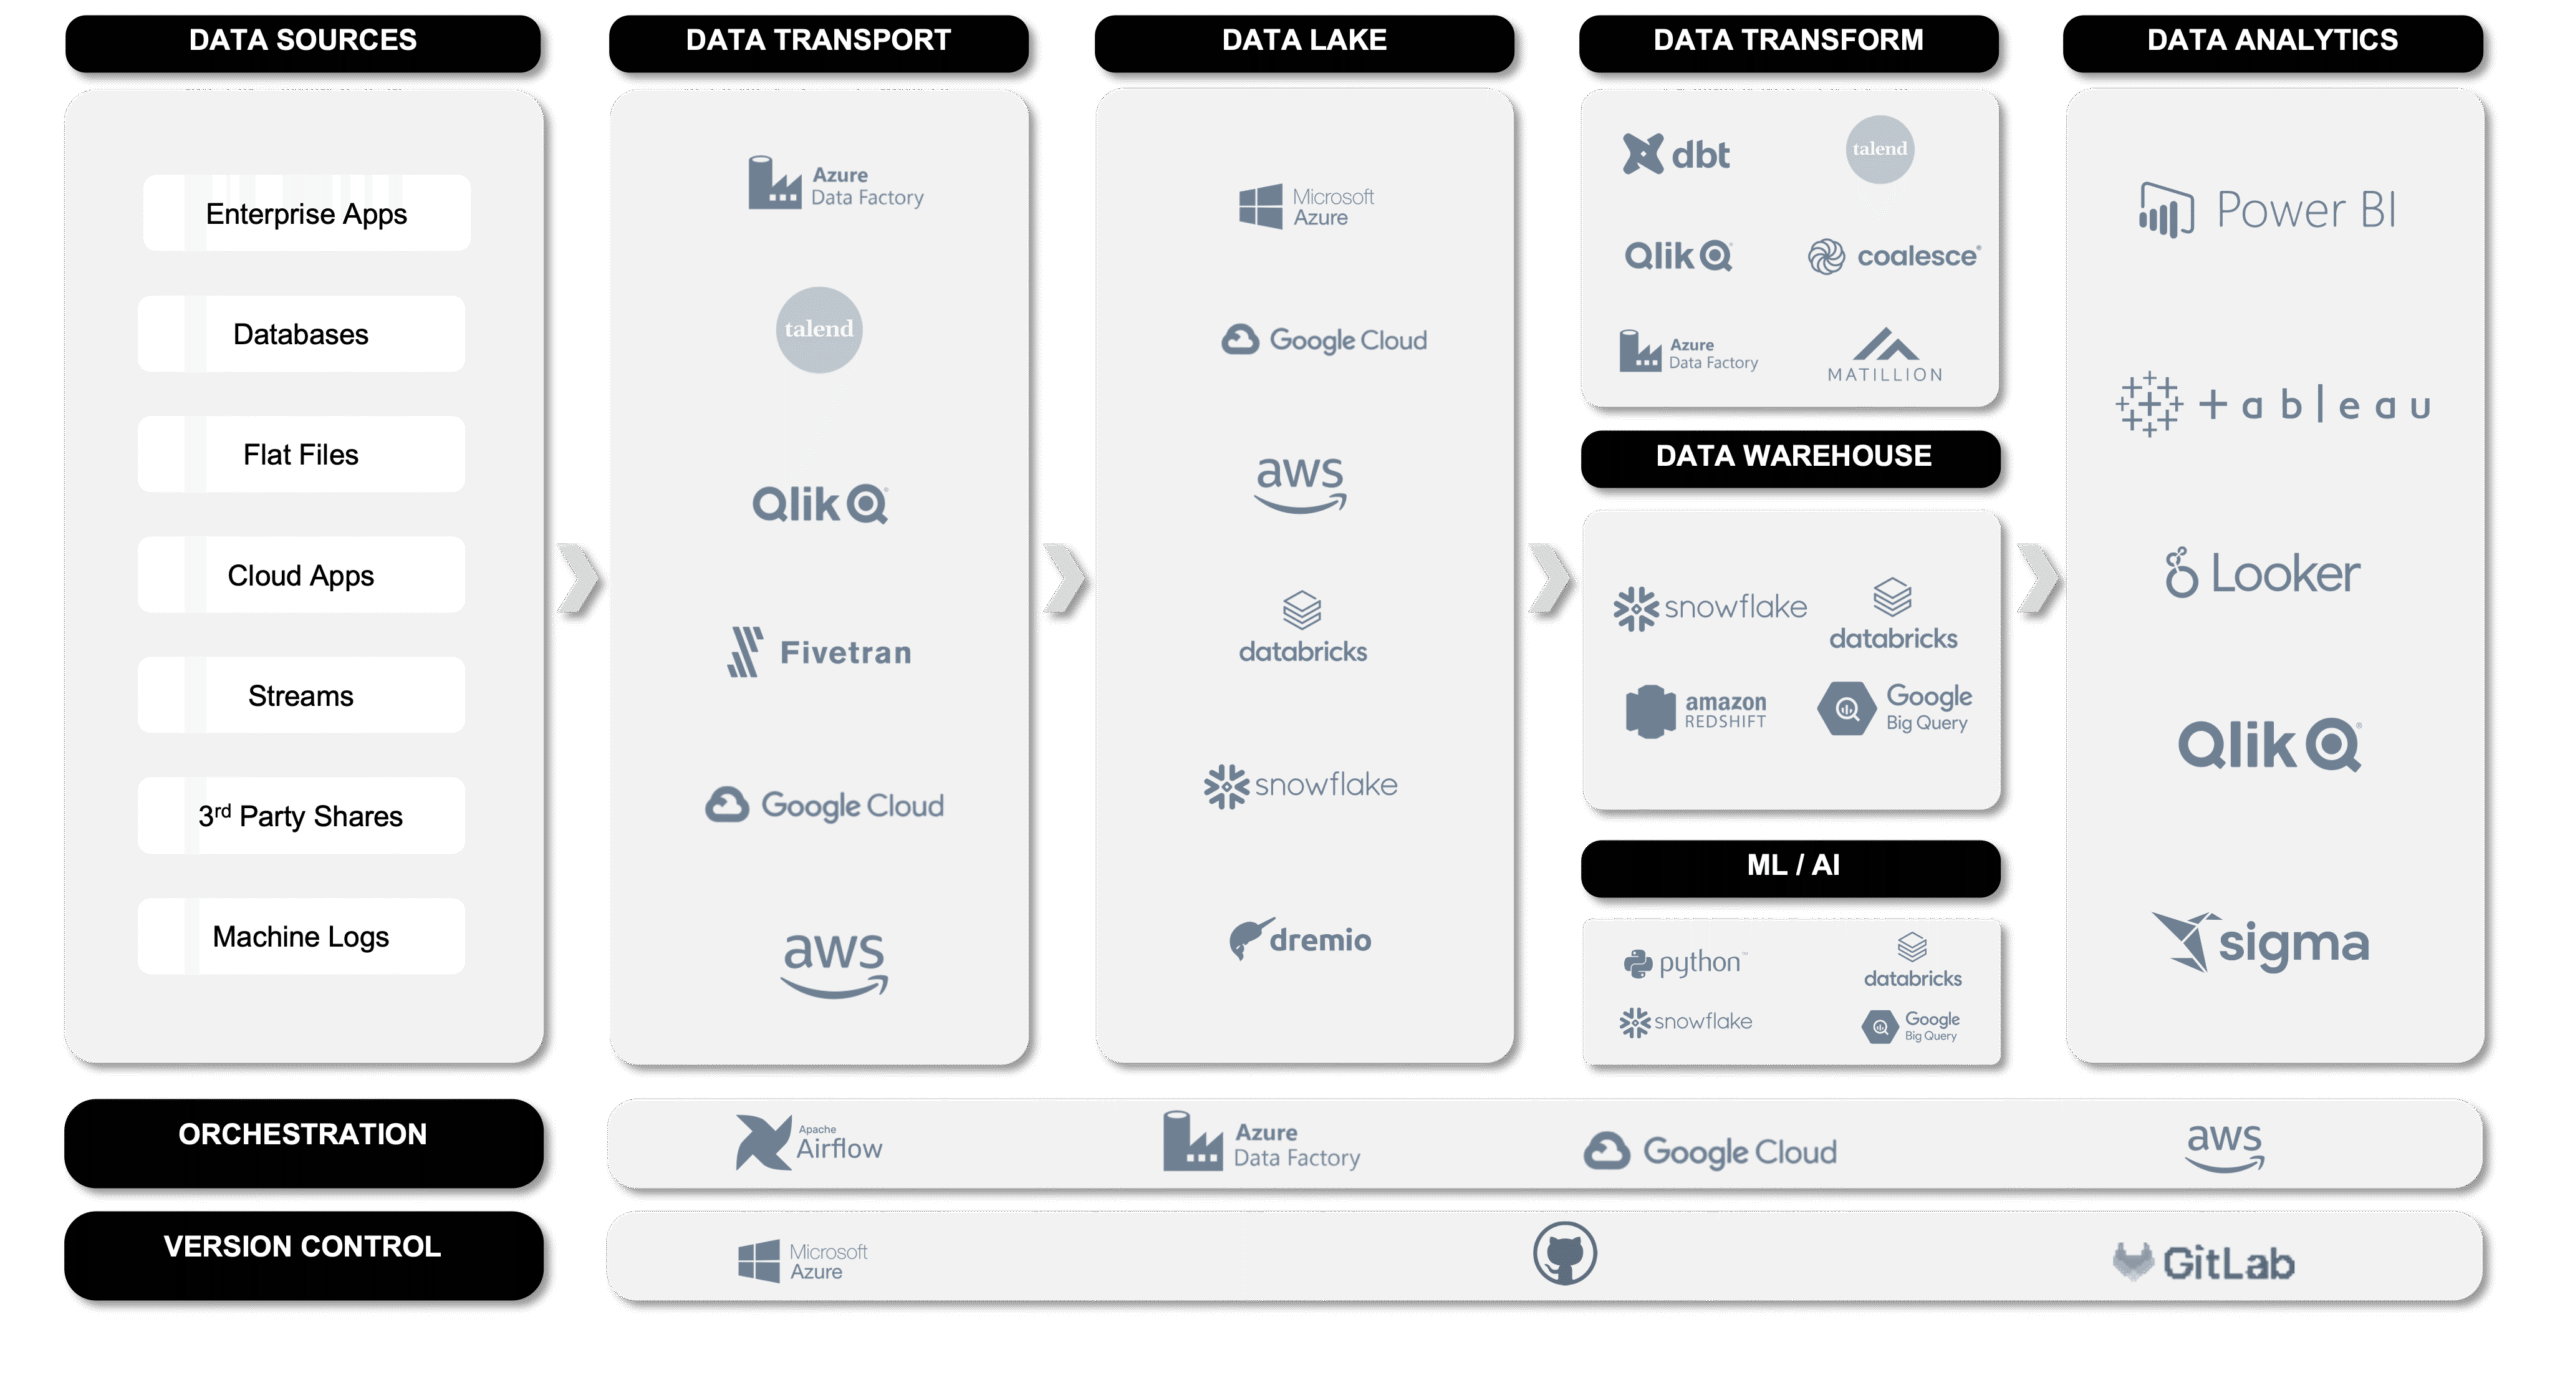
Before selecting a BI tool that’s right for your environment, it’s essential to actively evaluate the tool’s compatibility with your data platform and back-end architecture. This process involves assessing how well the tool integrates with your data sources, transport, storage, and transformation workflows, including any machine learning or AI pipelines. An informed selection ensures that the BI tool not only fulfills technical needs but also effectively aids your company in achieving its business objectives.
BI and analytics tools are not standalone entities; they must integrate and operate in harmony with all the software and tooling you have behind it.
BI Tools in the Context of Organizational Use Cases
To help narrow your focus, think about who within the business will be using the BI tool and the ways in which they will use it. A comprehensive comparison of BI tools considers various organizational use cases — such as the ones below — to help you find the best fit, including:
Enterprise Reporting: Enterprise reporting is commonly defined as analytics that spans across several business units within your organization (i.e., sales, marketing, and finance) for the purposes of internal reporting. Typically, this entails a wider deployment across multiple business users, data sources, and the expectation that users will be using your data analytics tool for their day-to-day analysis. If your organizational analytics and requirements are centered around traditional enterprise reporting, then starting with industry-leading tools like Qlik, Tableau, and Power BI is a safe bet. These tools have market longevity in their respective platforms, robust cloud capabilities, active user communities, and R&D investment that allows for continual feature releases. These can be considered the tried-and-true options with the industry experience and depth to back up most customer use cases.
Single- or Hybrid Vendor Approach: Often, organizations will choose to build their solutions entirely on one vendor platform (i.e., Microsoft Fabric). However, hybrid or modern data stacks (i.e., FiveTran/dbt/ Snowflake) have increasingly grown in popularity. When taking a hybrid approach to building a modern data stack, you need business intelligence software built to take advantage of your data warehouse layer, not one constrained to a specific vendor platform. We commonly see tools like Sigma and Looker fit this niche incredibly well. Both tools are positioned to fit well within a modern data platform and are great for self-service analytics, guided analytics, and embedded analytics.
Embedded Analytics:Embedded analytics places analytics at the point of need — inside a workflow or application — and makes it possible for your users to take immediate action without needing to leave the application. If your focus is on embedded analytics, Sigma is a great tool. Sigma has put a heavy product emphasis within the embedded analytics space, but it can also work well in a traditional enterprise reporting setting. Sigma continues to place a heavy emphasis on its embedded capabilities, and it is core to their platform.
Analytics Novice: For organizations just starting their business analytics journey and not wanting to make a significant investment upfront, low-cost alternatives exist that make the barrier to entry relatively low. Two great options that fit this use case are Power BI Pro licensing and AWS QuickSight. Power BI Pro licensing provides a low-cost, per-user entry point for clients looking to pilot Power BI. AWS QuickSight has several different licensing tiers that allow clients the flexibility to choose which option works for them.
Organizational use cases help to narrow your focus in tool selection. But ultimately knowing where each analytics tool fits in your respective data framework is of equal importance. Consider this your “cheat sheet” on BI tool comparison.
Pros:Power BI has established a major foothold in the BI and analytics space in a few short years. Its native integration within the Office 365 stack, flexibility in terms of back-end deployment options, and relatively cheap entry point with Power BI Pro licensing make it omnipresent in almost every tool evaluation Analytics8 has led for our clients in recent times. Power BI can be deployed in a variety of methods in terms of back-end data integration (Import, DirectQuery, LiveConnection, or Dataflows), and that flexibility alone opens multiple avenues in architecting your solution. And with the advent of Microsoft Fabric this year, Power BI takes on even greater precedence within the Microsoft Data Analytics platform.
Cons: Because it’s a Microsoft product, Power BI is oriented toward customers with an investment in the Microsoft stack. While hybrid approaches (Snowflake hosted on Azure to Power BI) are feasible, the potential downside to Power BI is attempting to fit it into a cloud architecture (AWS or GCP) in which native integration is limited.
Pros: In terms of a time-to-value proposition in building an application from the ground up to production, Qlik is a definite market leader. Its associative data model remains to me one of the most powerful features in an analytics tool period, and it’s making a significant investment in its SaaS platform as well as advanced analytics functions in its search-based capabilities.
Cons: Qlik is one of the few remaining “independents” that does not have a native back-end cloud platform (i.e., AWS/QuickSight, Azure/Power BI, GCP/Looker) and it’s to be seen how that will affect direction long term in an industry that is rapidly driving toward convergence. On the other hand, Qlik is attempting to bridge the gap with Qlik Replicate and the recent acquisition of Talend. These complimentary tools form what will be an end-to-end data platform for Qlik users.
Pros:Sigma is a relatively new entrant to the data analytics market and helps to simplify the data analysis process for any business user within the organization. Its user-friendly, spreadsheet interface gives users a familiar vehicle in which to conduct their data analysis. Sigma is excellent for direct discovery use cases (i.e., going down to the lowest level of granularity easily), takes advantage of the infinite scale of your cloud data platform behind it, and affords sleek feature functionality in the form of input tables, text generation, and the ability to easily embed analytics.
Cons: Sigma’s performance is closely tied to the performance of your cloud data platform, so it requires the proper due diligence at the warehouse or lakehouse layer to properly optimize and build your underlying dimensional models. Sigma plays very well in situations leveraging Snowflake, Databricks, BigQuery, Redshift, or PostgreSQL as the back-end data platform, but does not align cleanly within the Microsoft ecosystem.
Pros: Looker defines itself not as a traditional BI tool but rather a modern data platform, and if your organization adheres to a modern data stack approach within the cloud, then Looker is an excellent fit. It is great for self-service, guided, and embedded analytics. One of its key differentiators is its semantic layer (known as LookML), which is essentially a way of writing and generating SQL. What this opens up is true data governance and version control with reusable models. If you make a change once, it flows and propagates to everything. Coming from a developer background myself, this is a huge win in terms of the level of collaboration it opens up between your dev team.
Cons: Looker is built with a dependency on a database or data warehouse, so if your approach is to use a few Excel spreadsheets as your source and begin developing, then this is likely a poor fit. It is important to note that performance will be tied to that of your data warehouse. Query optimization and indexing within your data warehouse layer takes on added precedence with a Looker implementation. Product direction has also increasingly become muddied after its acquisition by Google, particularly with the merging of Looker and Google Data Studio (now rebranded as Looker Studio).
Pros: Tableau can be considered the industry leader in terms of visualizations and front-end aesthetics. Tableau has a robust user base, ecosystem, and long tenured standing within the analytics industry. Tableau Prep has helped to bridge the gap in the tool’s ETL and data prep capabilities that was previously filled using Alteryx as an intermediary.
Cons: Tableau still has weaknesses in its overall ability for embedded analytics and needs a strong data warehouse component or intermediary layer to scale effectively. A development path outside a traditional data warehouse is achievable, but only when tools such as Tableau Prep, Knime, or Alteryx are utilized. This approach also means data logic is constrained within the tool (s) themselves as opposed to a central, governed data warehouse. Tableau has also seen product innovation stall recently as a result of the Salesforce acquisition.
Selecting the right BI and analytics tool involves more than just assessing software features — it involves a thorough BI tool comparison. It requires understanding your unique data environment, scalability needs, and future growth plans. A well-executed proof-of-concept can reveal the tool’s fit and potential for your organization. Moreover, considering the tool’s growth trajectory and user adoption aspects is critical.
For a more in-depth framework to aid in your BI tool selection, check out our comprehensive guide: ‘BI and Analytics Tool Selection Framework: Core Components Required for Success‘. This resource dives deeper into the critical factors to consider when choosing the right BI tool for your business, ensuring you make an informed decision that aligns with your unique business objectives and data strategy.
Case Study: Comprehensive BI Tool Selection Process Made CCA Confident in Their Choice
Facing challenges in analyzing community needs and disparities, our client — Civic Consulting Alliance — needed a robust analytics solution. The goal was to create an insightful tool for data-driven decision-making in community projects. A proof-of-concept involving five modern analytics tools helped CCA to make an informed decision for their BI tool selection.
As a result, CCA now benefits from automated, up-to-date reporting, enhancing its focus on racial equity and informed community support. Discover how they made their choice.
Talk With a Data Analytics Expert
Key Takeaways
Choosing the right BI tool depends on how well it fits within your overall data architecture and integrates with your modern data stack.
Different BI tools serve different organizational needs such as enterprise reporting, embedded analytics, or low-cost entry for beginners.
Tools like Power BI, Tableau, and Qlik are reliable choices for broad enterprise use with strong ecosystems and robust features.
Sigma and Looker work well in hybrid or cloud-native environments and support embedded and self-service analytics.
Each tool has strengths and trade-offs in areas like integration, customization, data prep, and cloud compatibility.
A proof-of-concept helps validate the best BI tool for your specific use case, user needs, and growth plans.
Kevin is our VP of Consulting and is based out of our Chicago office. He leads the entirety of our consulting organization, including 100+ consultants in the U.S. and Europe. Outside of work, Kevin enjoys spending time with his wife and two daughters, going to concerts, and running the occasional half-marathon.
When creating data visualizations and dashboards, it’s not just about creating “pretty charts.” It’s about effectively communicating the meaning of data to your users. Here are 6 tips to create powerful data visualizations in your BI and analytics platforms. Data-driven decision making is integral for any organization. However, just because you have the data, doesn’t…
In this blog, we will show you how to bring data from Project Online into your existing reporting environment, such as Qlik or Tableau. We’ll also show you how to work through a pesky bug that may accompany your implementation. Project management is important to any release. There are several quality tools out there to…
In this blog, we provide insight as to why manual data practices can bring unnecessary risk to your projects and how to overcome those obstacles. Why Manual Processes Aren’t “Good Enough” While every analyst knows that automation practices lead to better data quality, more accurate reporting, and ultimately the ability for them to focus on…
We had the opportunity to interview the Director of Analytics Services at EDUCAUSE to learn more about how they’re getting their higher education association members to be more successful with their data. Here’s what she had to say. Data and Analytics in Higher Education About EDUCAUSE and Leah EDUCAUSE is a higher education technology association…
Companies utilizing BI tools often rely on constant data refreshes, which is adequate for some daily reports and dashboards. But as streaming data becomes more popular and 24×7 customer expectations increase, refreshing is not enough. To meet evolving business demands, Power BI offers two options for real-time reports and dashboards. Analytics systems working in near-…
In this blog, we discuss the elements of a style guide that will increase user adoption and take full advantage of the powerful design tools within Power BI. User adoption is crucial to the success of any business intelligence (BI) implementation. A BI developer can create rich reporting that uncovers valuable insights, but if the…
Data Strategy Session
To thrive with your data, your people, processes, and technology must all be data-focused. This may sound daunting, but we can help you get there. Sign up to meet with one of our analytics experts who will review your data struggles and help map out steps to achieve data-driven decision making.
Fill out this form to get a 30-minute Data Strategy Session with one of our analytics experts.
Contact Us
Have questions? Tell us a little about yourself, and we'll get in touch as soon as we can.