
Last updated on December 15, 2023
BI and Analytics Tool Selection Framework: Core Components Required for Success
By Kevin Lobo
In this blog, we delve into the five key components of the BI and Analytics Tool Evaluation Framework which guides organizations through the nuanced process of choosing a tool that aligns with their unique needs and objectives.
Selecting the right BI or analytics tool can be a challenging endeavor — there are many great options in the market, but there are critical factors you must consider to ensure the tool aligns with your organization’s specific data needs and future growth plans.
Analytics8 has helped hundreds of organizations with tool selection through tool assessments, ‘bakeoffs’, and proof-of-concept builds using the guiding framework below.
In this blog, we cover the foundational steps we recommend taking in order to guide you through selecting the right BI or analytics tool, including:
- Determining the Tool Fit: how to align the tool with your data systems and growth trajectory. ↵
- Considering Your Data Platform: how to match the tool to your specific data architecture. ↵
- Accounting for Data Transformation: how to determine where data logic will be stored. ↵
- Weighing the Intangibles: Ways to ensure the less tangible aspects of the tool are considered. ↵
- The Migration: how to create a practical and strategic plan for switching to a new tool. ↵
#1: Determining Tool Fit
This step is pivotal for ensuring a BI tool effectively aligns with your organization’s existing and future data architecture, operational needs, and growth plans. It involves assessing the tool’s compatibility with back-end data platforms, learning curve for developers and users, financial implications of licensing models, and capacity to scale and be widely adopted.
When evaluating overall tool fit, consider these key factors:
- Optimal fit within your current or anticipated architecture: The right tool should not only interface well with your current systems but also adapt to future data needs. It’s a core component of your data ecosystem, vital for seamless connection to data sources and efficient data handling. Remember to regularly review its fit, particularly as technology evolves.
- User and developer learning curve: A complex tool can hinder adoption, so prioritize a tool that’s user-friendly and accessible to all skill levels. Foster a learning environment, perhaps through a community of practice or a center of excellence, to ensure comfort and proficiency with the platform.
- Anticipated scale and adoption: Choose a tool that can scale with your organization’s growth and technological advancements. It’s not just about the current fit but also about future capabilities. Widespread adoption is a sign of having the right tool, but truly effective use of the tool is when it enhances data processes and decision-making.
Tip for Tool Fit Assessment: Carry out a detailed compatibility test between your existing data platforms and potential BI tools. The assessment should cover the tools’ technical abilities plus their ability to meet your specific data analysis requirements. Test the tools in scenarios that mirror your typical data workflows to understand their real-world functionality.
#2: Considering Your Data Platform
The choice of BI tool should be heavily influenced by the nature of your data platform and its fit with your back-end architecture. Consider data sources, data transport, data storage, data transformation workflows, and any associated machine learning or AI pipelines.
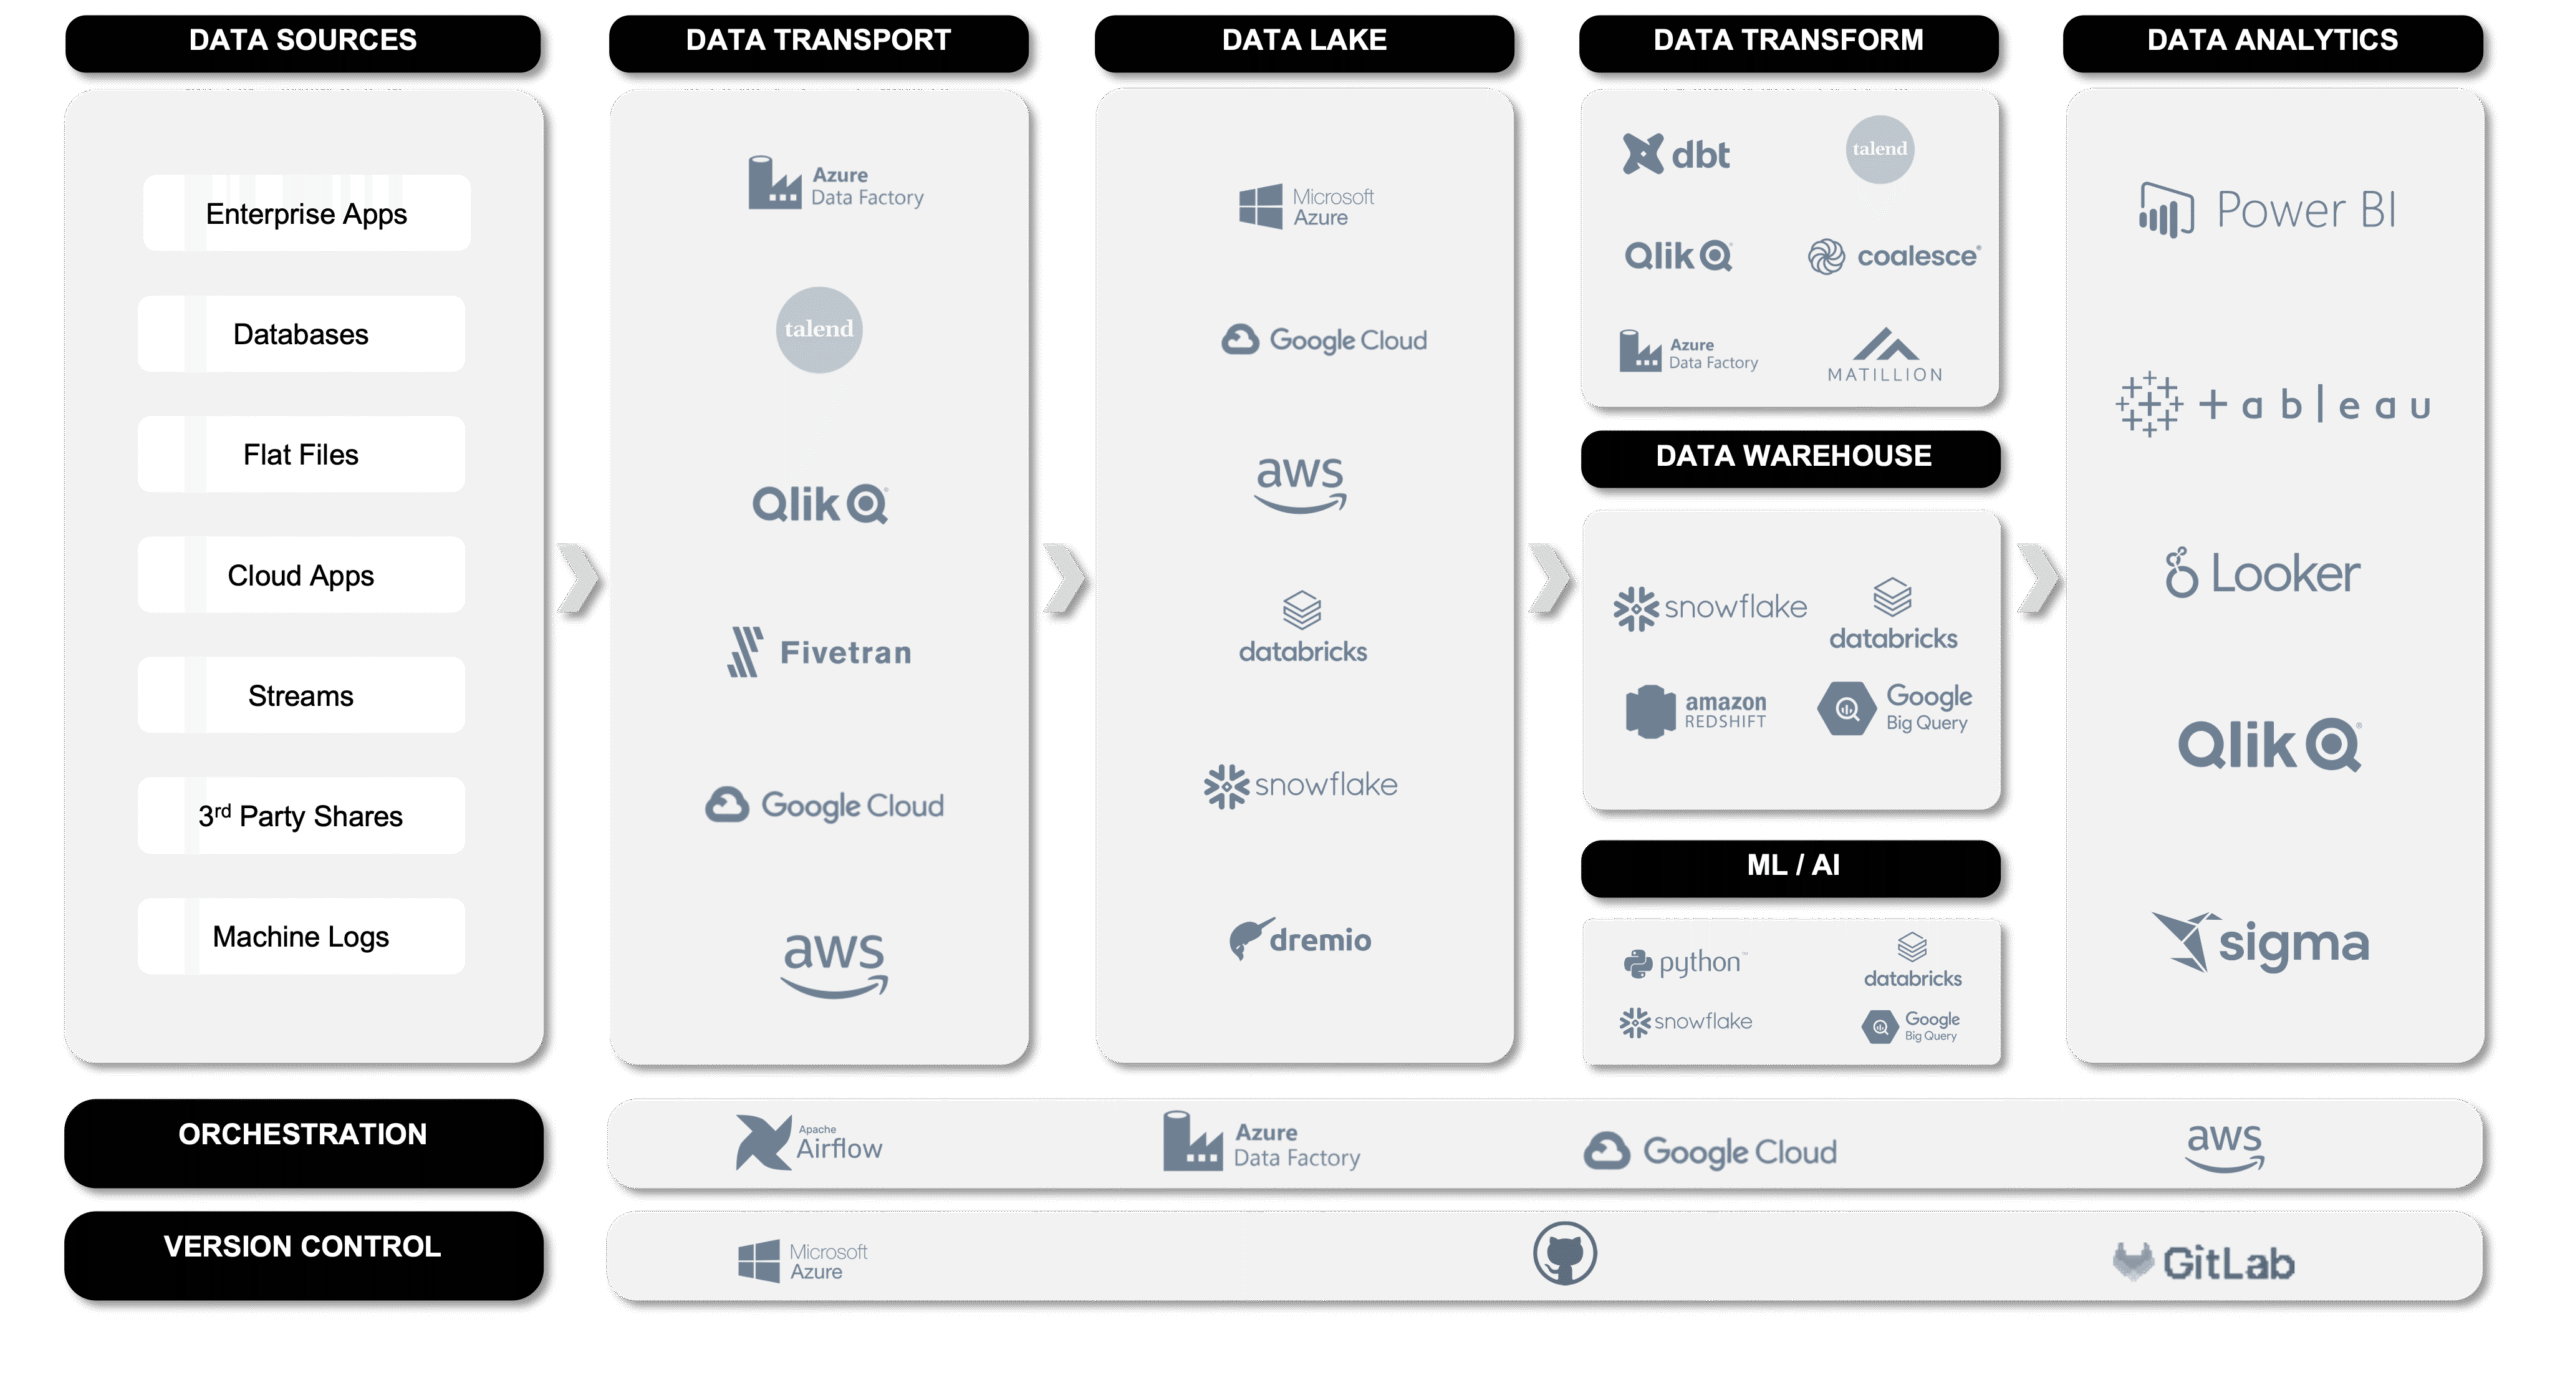
What best describes your data platform?
Before you select a BI or analytics tool, look at what best describes your current data platform today, or where you want to go in the future: modular, cloud, or decentralized.
Here is some guidance based on your platform:
#3: Accounting for Data Transformation
When selecting a BI tool, determine where the data transformation logic will best serve your organizational needs. This strategic placement directly affects data flow and tool efficiency. While BI tools may offer some transformation capabilities, the goal is to utilize them in a way that aligns with your architecture, ensuring a streamlined data pipeline and effective use of system resources.
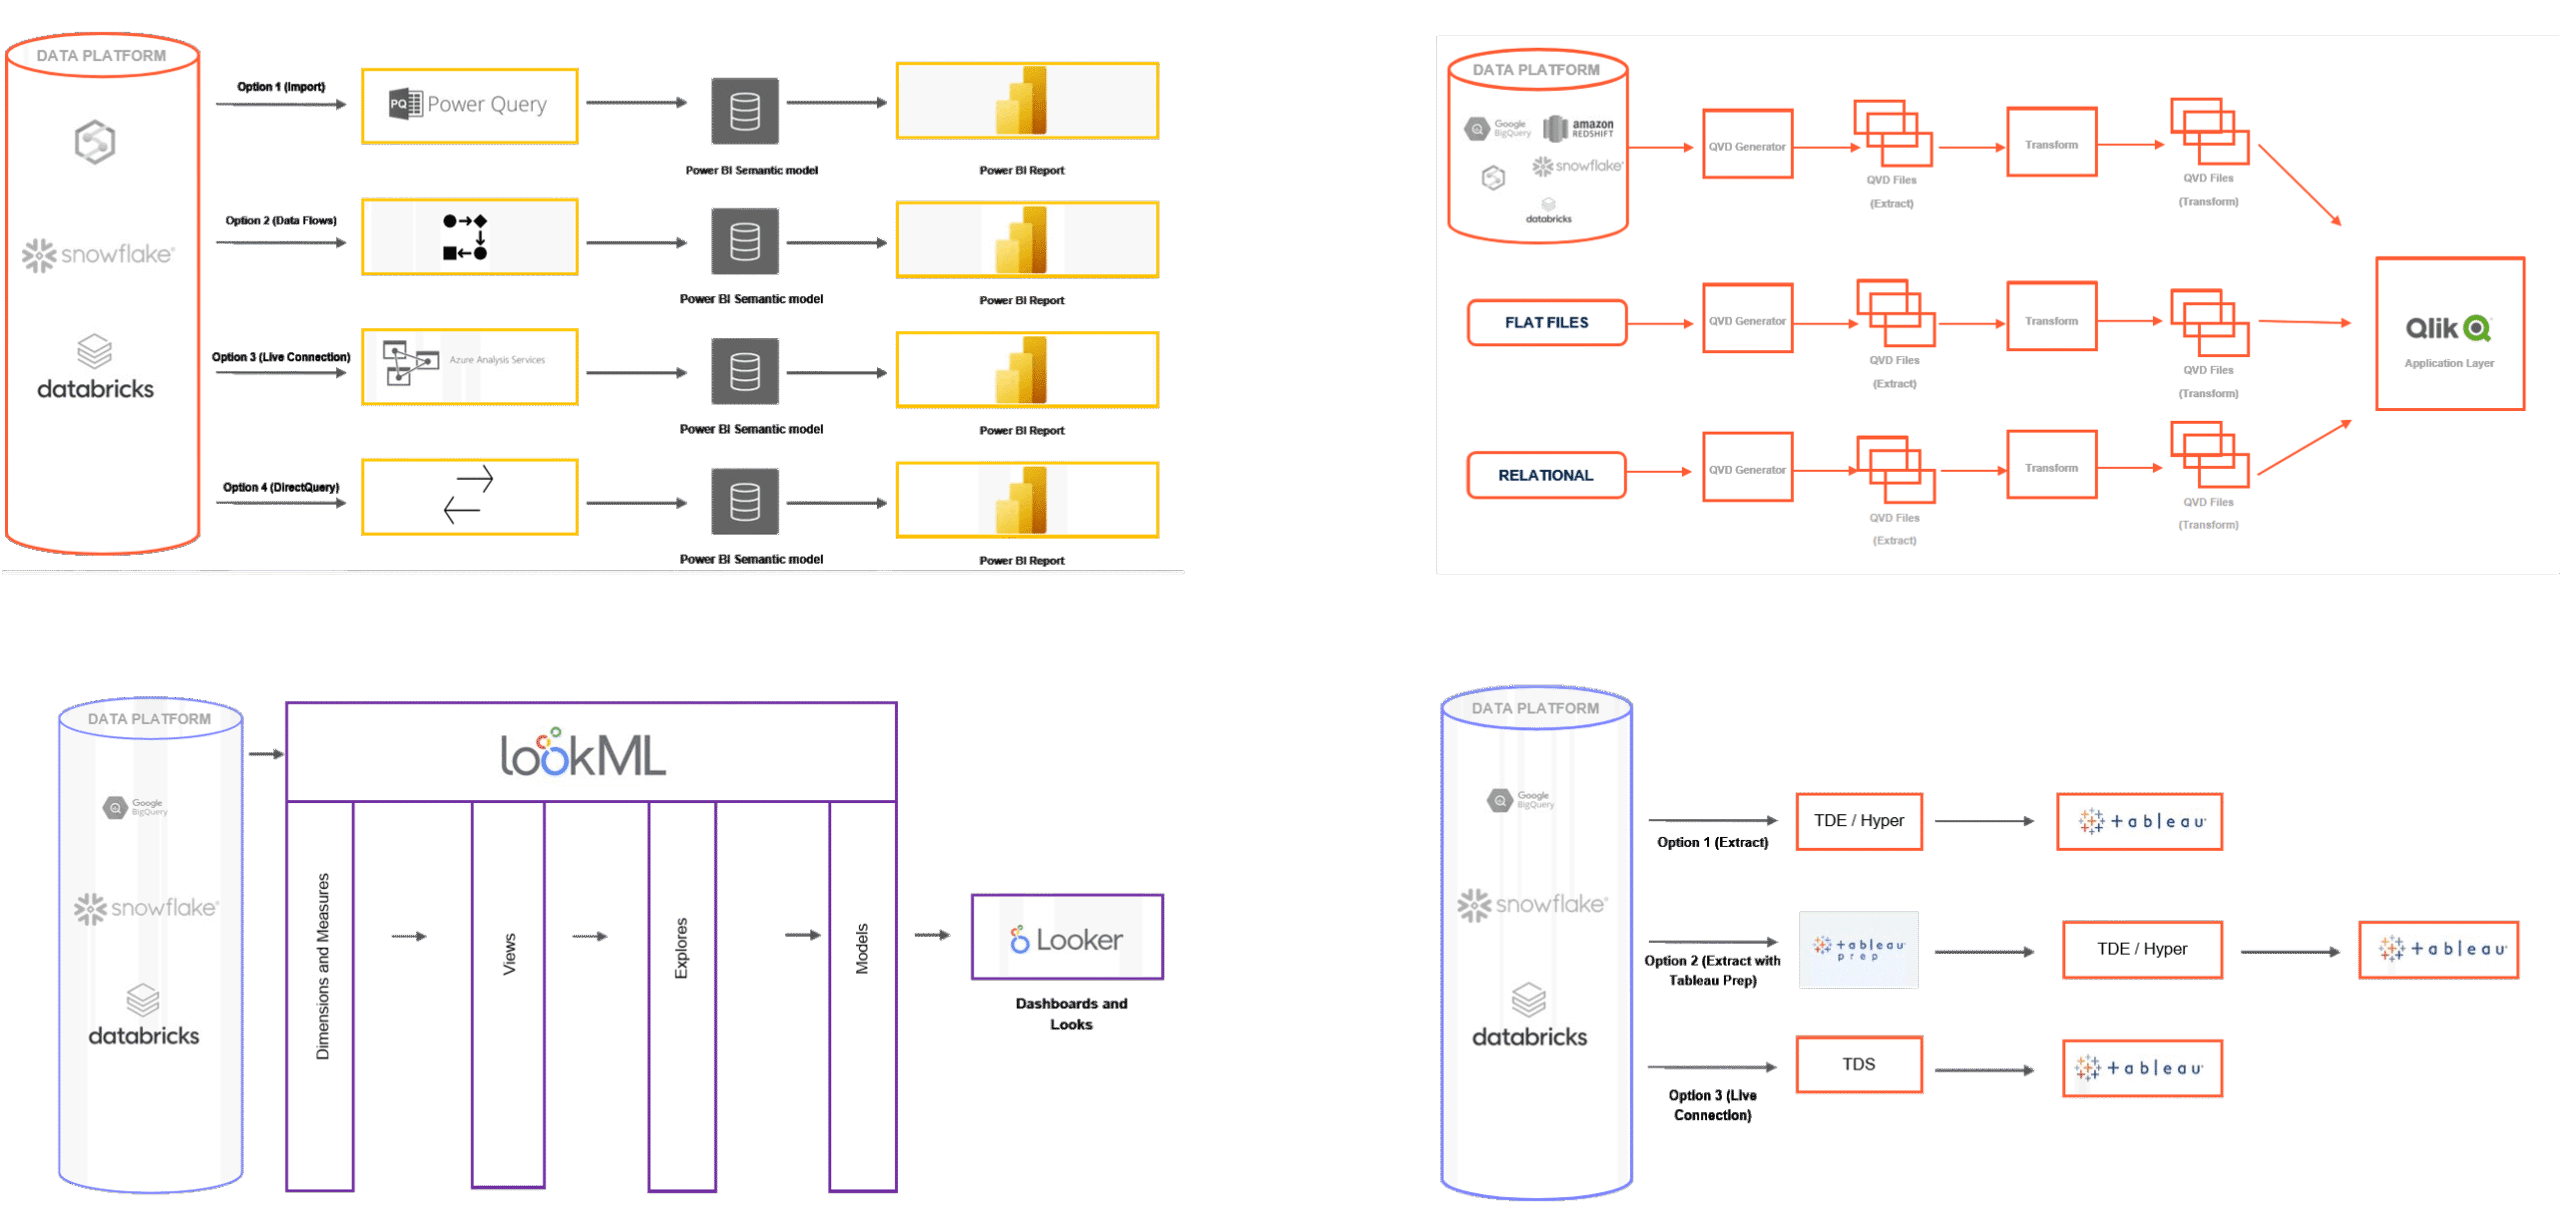
Here are some tips to ensure the role of your BI tool is contributing to efficient data management:
#4: Weighing the Intangibles
Consider elements beyond technical specifications that influence user and developer satisfaction. There are three main intangibles you should consider when selecting your BI or analytics tool:
#5: Migration Plan
When it’s time to migrate to a new BI or analytics tool, you need a strategic and thoughtful plan to ensure a smooth transition. Your plan must account for all elements of the technical infrastructure and user experience, including thorough report rationalization, UX/UI, data source reconciliation, and a meticulously planned cutover strategy. The plan should minimize impact and optimize adoption across your organization.
Before making the move, ask these three questions:
1.) What needs to be carried over?
Start your migration plan by taking stock of the adoption and usage of your current BI reports. Assess which reports are being utilized and are essential to carry over to the new tool. This step is your opportunity for a “spring cleaning” of your BI environment, allowing you to declutter and migrate only what’s necessary. Engage with end-users to understand their needs and usage patterns, ensuring that the migration focuses on high-value, actively used reports and retiring those that are redundant or obsolete.
2.) Is data accessible and available for the reports you want?
Once you identify what reports need to migrate (or be built new), ensure that the necessary data sources are both accessible and complete. This is fundamental; without the necessary data, development in the new BI tool can stall. Verify the availability of each data source required for your initial use cases to guarantee a smooth, quick transition and to facilitate early adoption of the new system. This thorough vetting, known as data source reconciliation, is key for a successful migration.
3.) Does my cutover plan minimize negative impact on the organization?
Devise a clear change management strategy. Decide if you’ll transition to the new BI tool gradually or maintain both the old and new systems in parallel for a time. This careful planning is critical for minimizing disruption for your business users. A well-communicated, phased approach can ease the transition and foster acceptance, turning a technology shift into an opportunity for positive change and improvement within your organization.