
Last updated on June 3, 2026
Six Ways Sigma Simplifies Data Analysis
By Rachel Dang
Sigma is a relative newcomer to the data and analytics market, having been launched in 2017. Despite its short time in the industry, it has already made significant strides, receiving $20M in funding in 2018 and being ranked on G2’s Best Software Awards for Analytics and AI products in 2022. Today, Sigma addresses the pressing need for direct discovery in data analysis and works particularly well in the Snowflake ecosystem.
But the question remains: is Sigma the right fit for your needs? After a thorough evaluation of the platform, we believe that it offers significant value, particularly for those seeking to streamline their data analysis processes. In this blog, we will explore six key features that Sigma offers and explain why you should seriously consider the platform for your analytics requirements.
What is Sigma, and What Capabilities Does it Offer?
Sigma is a cloud-based analytics platform that simplifies the data analysis process for any business user within an organization. With its user-friendly interface, users can easily explore, analyze, collaborate, and share insights quickly. The tool offers in-platform data lineage for enhanced transparency, multiple customer support channels for real-time assistance, and collaborative sharing and reporting. Sigma also integrates directly with popular data sources and other tools to make the data analysis process more seamless. There is no need for coding or technical know-how — Sigma is built to be intuitive, connect to any cloud database (Snowflake, Amazon Redshift, Google Big Query, PostgreSQL, Databricks, AlloyDB) or cloud platform (GCP, AWS), and provide a spreadsheet-like output for quick analysis. Built for the modern data stack, the platform is a fast and easy way for an organization to use data in its everyday work.Six Ways Sigma Offers Quick and Intuitive Analytics for Business Leaders
1. User-friendly interface:
Sigma offers a simple and intuitive interface for easy data manipulation and visualization. Even those without technical skills or coding knowledge can quickly create valuable insights from their data using intuitive visualization options.- Any user can create ad-hoc visualizations and drill down to the granular level of their data, as well as perform “what-if” scenarios.
- Sigma provides a familiar experience for users with little visualization experience so that they can still create meaningful dashboards with visualizations they know how to use (i.e., pivot tables, bar graphs, and charts).
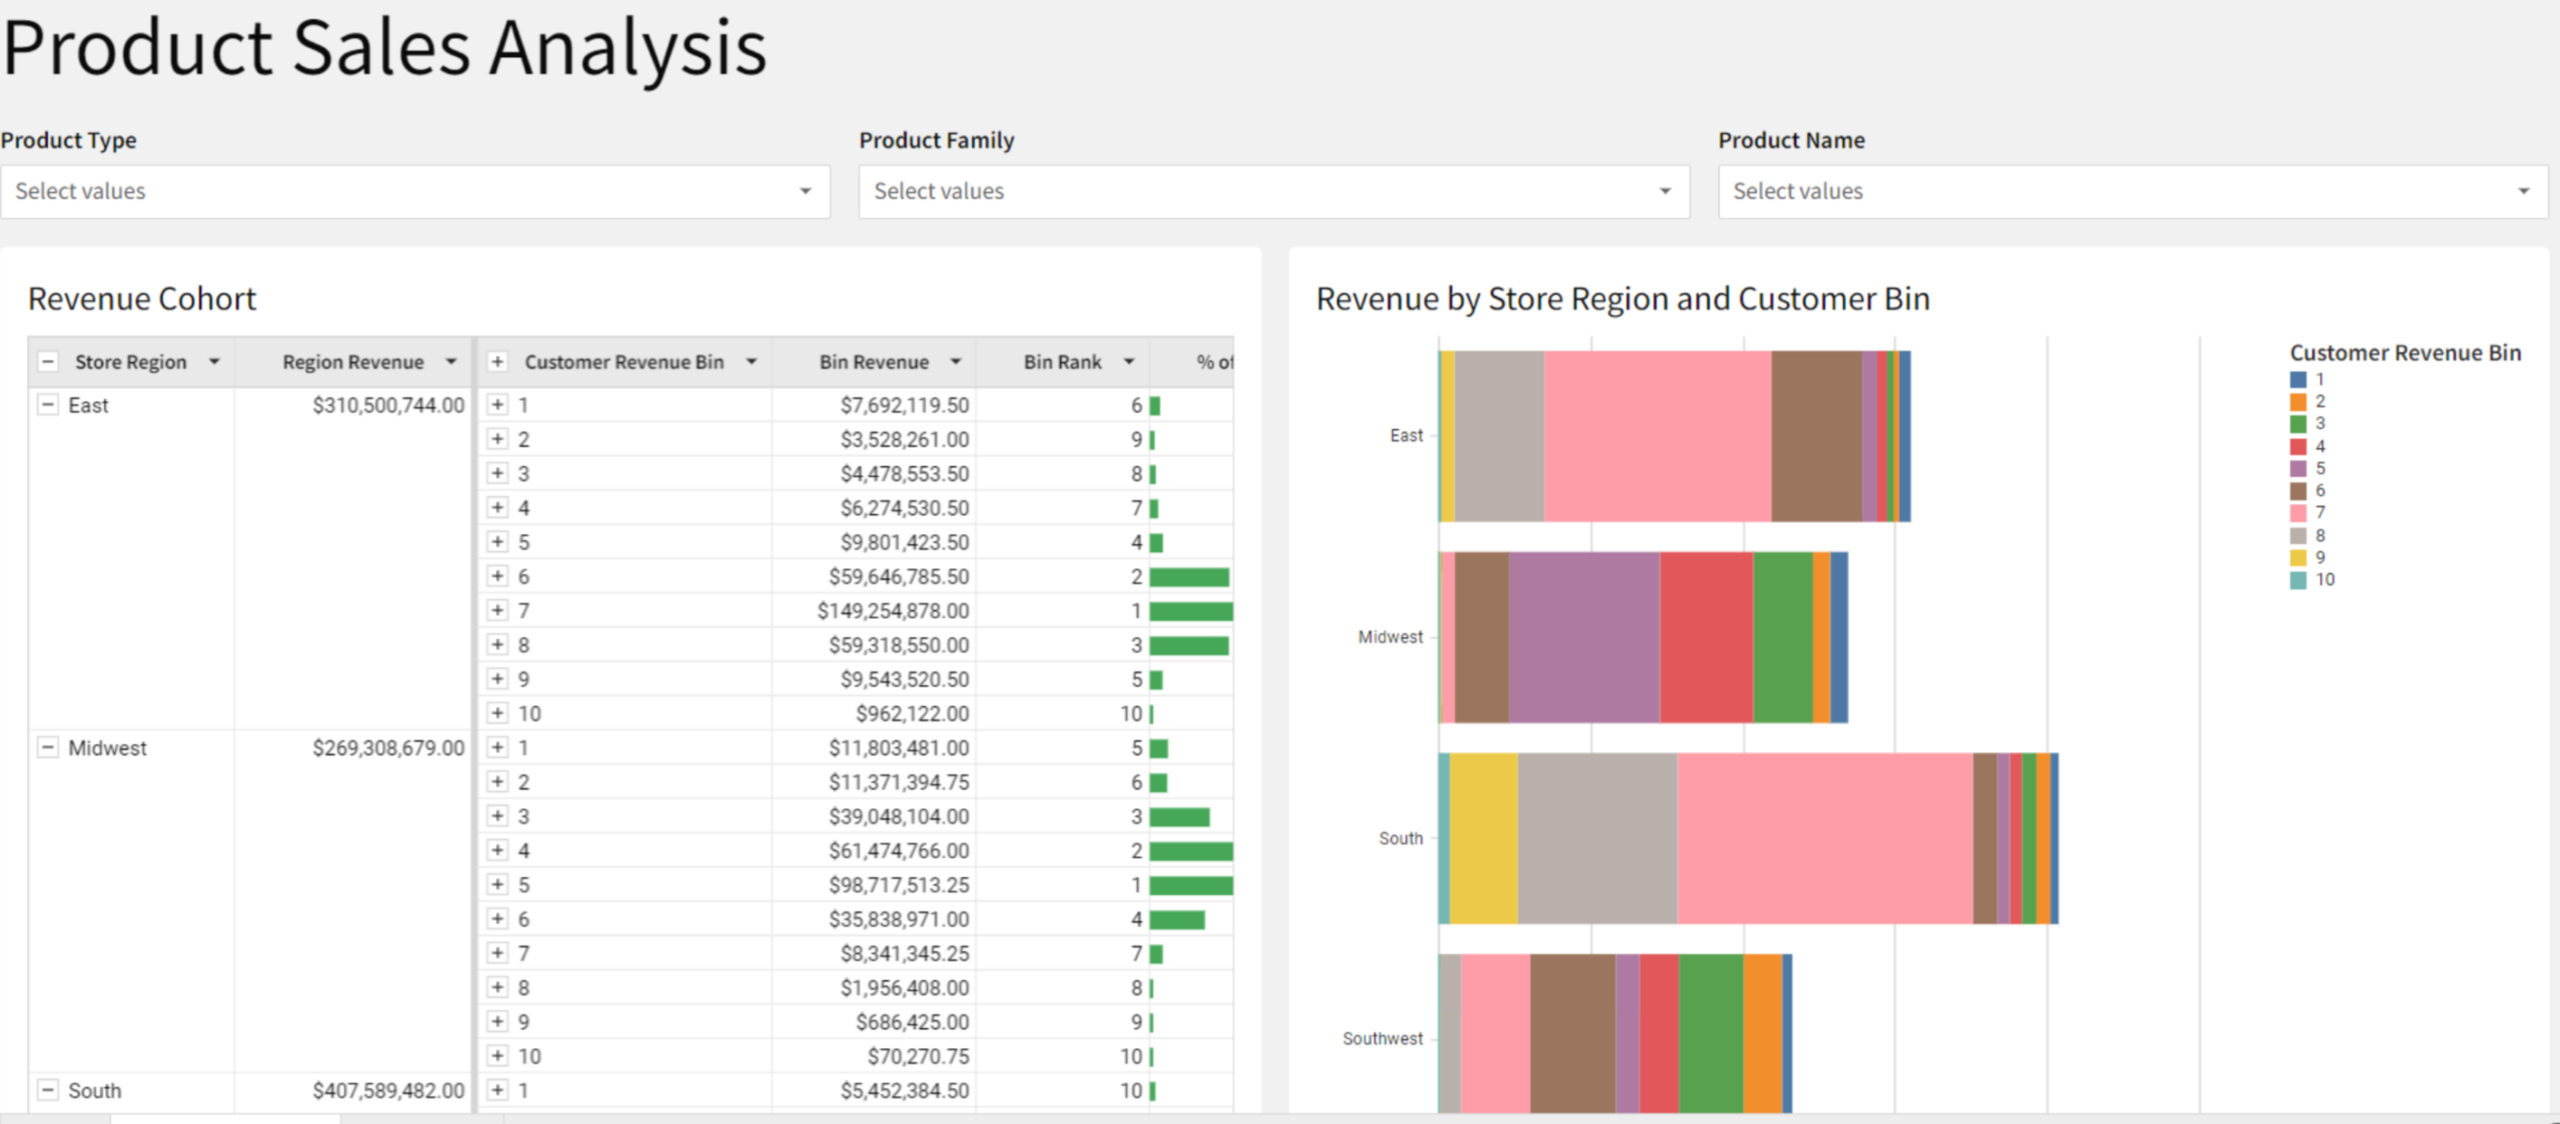
Sigma’s spreadsheet-like feel makes it easy to create dashboards to generate meaningful insights from your data.
- Tables can be joined, and custom columns can be made without using code.
2. In-platform data lineage:
With Sigma’s in-platform data lineage capabilities, users can view the source of each visualization and understand relationships between tables.- Lineage views populate automatically after table joins are made, providing a better understanding of the data relationships.
- Users can easily see how a change in a dataset affects certain visualizations.
- Finding errors or unexpected data is made simpler with clear lineage information.
3. Multiple customer support channels:
With Sigma’s help desk, user community, and direct email support, users can quickly get the assistance they need to start exploring their data.- The help desk acts as an FAQ with helpful sections around topics such as Data Modeling and Administration.
- Users can submit tickets for more complex issues and get in touch with a member of the Sigma team directly via email.
- Access to the User Community allows users to see questions and suggestions made by others and post their own questions to be answered by the community and Sigma staff.
4. Real-time data visualization:
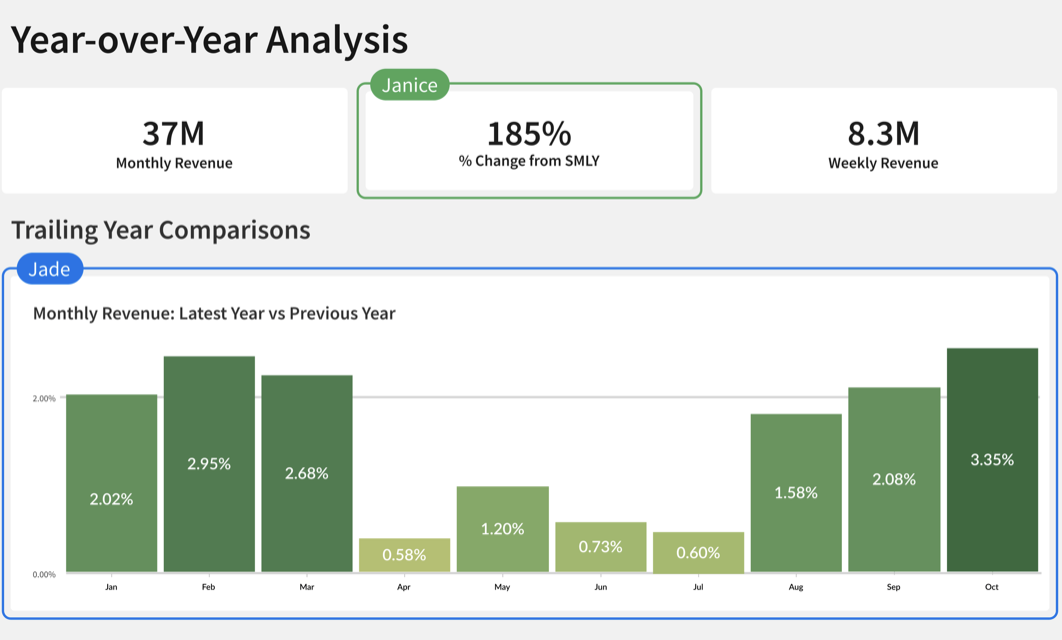
With visualizations and reports updated in real-time to reflect backend data, business leaders can access the most up-to-date information for informed decision making.- Data is refreshed every time a user opens or manually refreshes the workbook, but refreshes can be set to a schedule.
- Dynamic reports can be created by using real-time data and updating visualizations on the fly.
- Collaborators can make changes to data sources and visualizations in real-time, making it easy to work with others and quickly make decisions based on the latest data.
- Sigma also offers embedded visualizations that offer dynamic charts and graphs that allow users to view changes in real-time.
5. Collaborative sharing and reporting:
Sigma’s built-in tools make it easy for teams to work together and present data-driven insights.- Users can access dashboards simultaneously, making it easier for teams to work together on data analysis and presentations in real-time.
- The platform provides access control and versioning, so that users can keep track of changes made to reports and who made them.
- A shareable link can be generated for ease of use and can only be viewed by users or teams with the proper permissions.
6. Integration with popular data sources and tools:
Sigma makes it simple to import data and start analyzing it, and it is easy to export data and visualizations to share with others.- Sigma offers easy and fast integrations with popular data sources such as Snowflake, Amazon Redshift, Google BigQuery, and others.
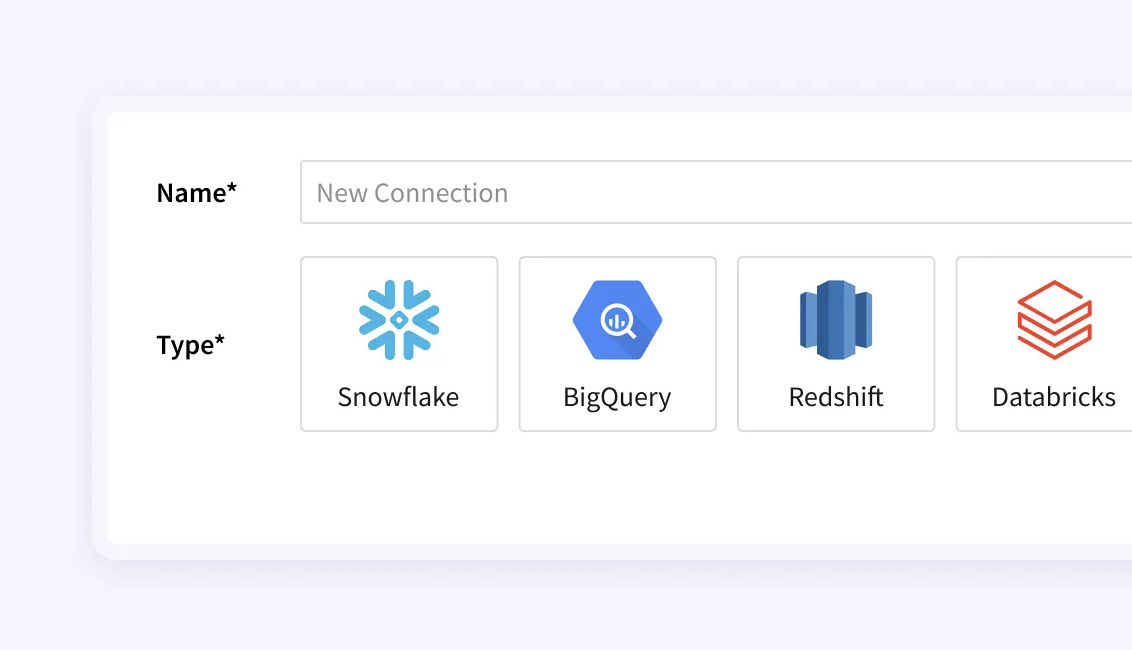
Sigma makes it easy for users to connect to a cloud data warehouse. Photo Credit: Sigma - Data can also be directly queried from a data warehouse using SQL and by uploading a CSV file.
- Sigma can be integrated with ETL platforms such as dbt.
[cta_callout modal_id=”15678″]Talk to an expert about your data analytics needs.[/cta_callout]
Getting Started with Sigma
Sigma is a powerful data analysis and visualization tool that can greatly enhance the way teams work with data. By taking advantage of the 14-day trial, users can get a feel for the tool and see how it can benefit their team. The Hands-On Lab exercise and tutorials are great resources for learning how Sigma works, and for those who want a more in-depth understanding, a demo with a Sigma professional can be arranged. Finally, the quick start guide is a valuable resource for anyone looking to get started with Sigma and to learn how to use the tool to its fullest potential. With these tips in mind, users can get started with Sigma and start making data-driven decisions with confidence.Talk With a Data Analytics Expert
Key Takeaways
- Sigma is a cloud-based analytics platform launched in 2017, designed to simplify data analysis for any business user.
- The platform offers a user-friendly interface making it accessible to users without technical skills or coding knowledge.
- Sigma provides in-platform data lineage features that enhance data transparency and help users understand data relationships.
- Real-time data visualization allows users to make informed decisions using the most up-to-date information.
- Multiple customer support channels are available, including a help desk, email support, and a user community.
- Collaborative tools enable teams to work together effectively, share insights, and maintain access control and versioning.
- Sigma integrates seamlessly with popular data sources and tools, making data import and export simple.
- The platform’s spreadsheet-like feel allows users to perform ad-hoc analyses and create meaningful visualizations easily.