
Last updated on May 24, 2022
How to Use Data Observability to Improve Data Quality and Ensure Proper Flow of Data
By John Bemenderfer
In this blog, we define data observability and discuss the activities needed to improve data quality and proper flow and use of data within your organization. We also go over tools you can use and best practices to get started with data observability.
It is impossible to run a successful organization without access to high-quality data that will inform decisions across the business. And although there are plenty of ideas—and tools—around how to ensure business users have the right data at the right time, there still needs to be a mechanism in place that ensures the data is, in fact, the quality that you need it to be. This becomes increasingly more difficult when you’re working with tens, if not hundreds, of different data sources that require the development and maintenance of countless numbers of data pipelines, data storage solutions, data warehouses, databases, and… well, you get the point—the complexity of these systems is large. Enter data observability.What Is Data Observability?
Data observability is a broad category of activities that allow you to maintain a constant pulse—to monitor, track, and triage any breakdowns in your data pipelines and workflows—in near real time. These activities allow data engineers and data analysts to quickly identify issues should they arise, but, more importantly, they are designed to allow for proactive issue resolution before downstream data consumers are impacted.Data observability is not performed using a single tool, but rather a mix of different activities that when combined, allow data engineers to identify, troubleshoot, and resolve issues quickly.It is critical to implement this foundational component before your organization’s data complexity grows. Without healthy, reliable, accurate, and timely data, the organization risks data quality issues, resulting in erosion of trust and disruptions in decision-making capabilities across the organization.
What are the Activities Needed for Data Observability?
Data observability activities include monitoring, logging, comparisons, tracking, alerting, and analysis, and allow data engineers to stay on top of any data issues before they arise, giving the developer enough time to address them before they lead to bigger problems.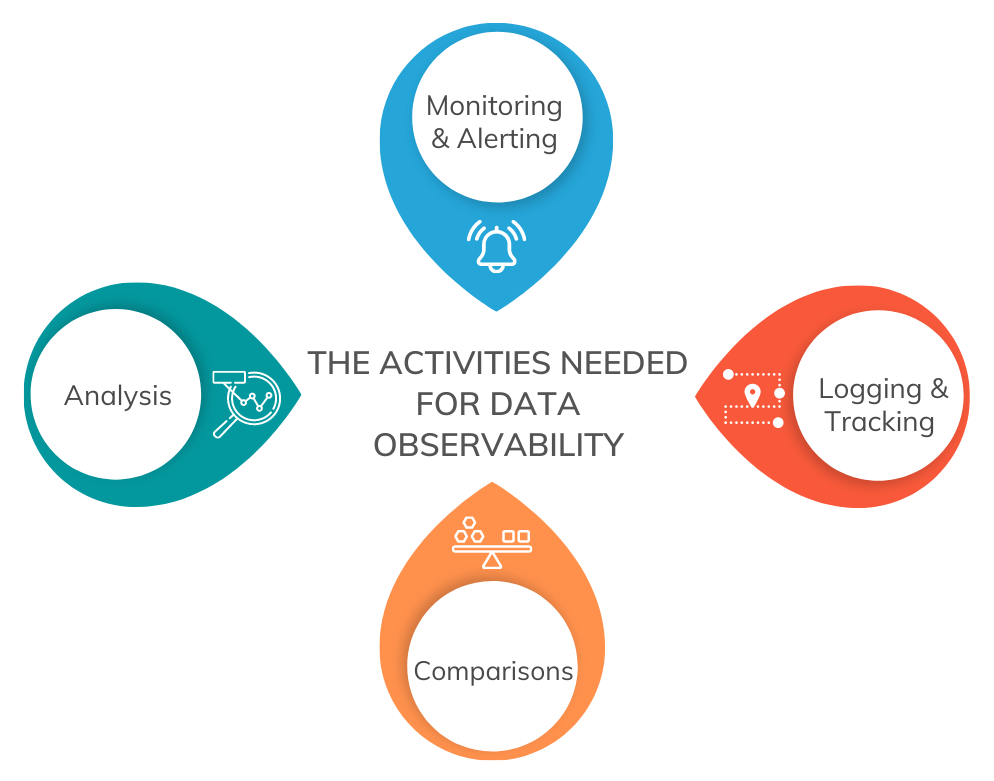
- Monitoring and Alerting allow a user, like a data engineer, the ability to analyze running pipelines or workflows to ensure data is flowing as expected. If a failure or some other event occurs, a descriptive notification will be sent to the appropriate party.
- Logging and Tracking allow a user to review running and previously run pipelines and workflows with status, start and end times, duration, etc., to inform the user of the system’s health.
- Comparisons allow a user to compare changes to a data pipeline to ensure proper output and health.
- Analysis allows a user to see trends within pipelines and workflows to ensure the developer can stay ahead of any growing problems. Another part of the analysis is allowing the user to analyze the data outputs to ensure the proper information is being generated.
How Does Data Observability Improve Data Quality?
There isn’t one singular cause of bad data quality—it could be from a number of things, including business process issues, lack of data standards, etc. And data quality can’t be fixed with just technology alone—you need people and processes, too. Data observability, however, enables organizations to address each dimension of data quality based on the five pillars in which it stands.- Freshness refers to the concept of having the latest available data as quickly as possible without any gaps. This pillar ensures the completeness of data.
- Distribution relates to the data’s attribute-level health. Are the metrics derived from the data’s attributes falling within an acceptable range of values? This pillar improves the accuracy and validity of the data.
- Volume is the amount of data in the source and target. As the source data travels down the data pipeline, the record count may change based on filtering and join logic. Are we extracting several thousand records and loading nothing? Are we loading a million records when only a few thousand are expected? This pillar ensures completeness and uniqueness.
- Schema refers to the structure of the data. At times, fields are changed (field name or datatype), removed, and added (enriched). These changes can affect downstream processes. This pillar ensures consistency, accuracy, and validity of the data.
- Lineage is the path the data takes, often the most important aspect of data quality. Similar to a family tree, lineage provides the traceability of the data to its origin. Lineage is a holistic pillar; it touches on every dimension of data quality as it allows data teams the ability to trace any error throughout the data ecosystem.
Why Organizations Should Invest in Data Observability
With tight budgets, limited resources, and short timelines, why should your organization invest in data observability? It may not be as attractive as a new business intelligence (BI) tool or as impressive as a new data warehouse, but that is the point of data observability—the pipelines and workflows should just work.While pipeline failures and data issues aren’t always predictable, they will happen and implementing tools and processes to identify those earlier, and quickly, are going to pay dividends in the future.Implementing data observability activities in your organization’s data ecosystem has the following benefits:
- Increased Trust: Arguably, the most important aspect in a data-driven organization is trust. If data teams can proactively resolve issues, triage them quickly, or communicate any impacts to downstream processes/users, the trust in the data increases. With increased trust comes increased use, and since data observability increases data quality, decisions are made more accurately with beneficial outcomes.
- Reduces Downtime: Knowing when and where something breaks can be one of the most time-consuming endeavors when an issue occurs in a data pipeline. With data observability, it is easy for a data team to identify where an issue occurred in near real-time, reducing downtime. For organizations with service-level agreements, this is even more important.
- Increases Accuracy: Transformations in complex enterprise reporting environments are common, and knowing if data changes outside expected ranges or values is easy when data observability activities have been implemented. Engineers can be alerted immediately after a pipeline is finished if there are any unexpected results, triage can occur, and accuracy can be ensured for report users.
- Data Lineage: If you’ve ever received the question “Where does this data come from?” you know it’s sometimes very difficult to answer. With data observability, knowing where data is sourced and what transformations occur is easy. Those questions go from hour-long investigatory adventures to minute-long searches.
[cta_callout modal_id=”15678″]Talk to an expert about data observability.[/cta_callout]
What Data Observability Tools Are Available?
Since data observability is a series of activities that occur in various places within your organization’s data stack, there is not one out-of-the-box solution. Most modern data and analytics tools used today have some features already built in to help with alerts, monitoring, and analysis. There are also tools that help bridge the gap for the remaining activities, including:- Monte Carlo: This is an end-to-end tool that is used to monitor data pipeline failures, helping to avoid downtime and ensure data completeness.
- Databand: This tool enables data engineers to work more efficiently in a complex modern infrastructure.
- Datafold: This is a data observability tool that helps data teams monitor data quality through diffs, anomaly detection, and profiling.
- Alerting: When picking a tool, make sure that there is some basic level of alerting, especially when something fails. You cannot fix a problem if you don’t know there is a problem.
- Monitoring: Ensure that there is an ability to monitor pipelines or transformations. Knowing that something is running and being able to monitor it allows your data engineers to communicate the progress to users and to other team members. This can help with development and saving time.
- Logging: Ensure the tool has logging, especially error, warning, and even metadata type logging. Being able to read error or warning logs helps ensure resolutions more quickly and provides engineers with information to build better fault-proof pipelines in the future. Metadata logging allows additional automated alerting for things like volume and completeness.
- Lineage: If a tool has automated lineage documentation, it should be considered. It helps data engineers and data analysts know where the data is coming from, what transformations are occurring, and where the data is available, helping identify and triage any issues.
Talk With a Data Analytics Expert
Key Takeaways
- Data observability is essential for maintaining high-quality, reliable, and timely data in an organization.
- It encompasses activities like monitoring, logging, tracking, comparisons, alerting, and analysis.
- These activities help proactively identify and resolve data issues before they impact decision-making.
- Data observability tools like Monte Carlo, Databand, and Datafold can help improve data pipeline management.
- Implementing data observability fosters increased trust, reduces downtime, and enhances data accuracy.
- Critical pillars of data quality, such as freshness, distribution, volume, schema, and lineage, are supported by observability.
- Organizations should invest in data observability as it offers long-term benefits by ensuring smooth pipeline operations.
- Effective data observability requires a combination of tools, processes, and practices tailored to your data ecosystem.


![Cloud Migration Strategy Guide [and Checklist]](https://www.analytics8.com/wp-content/uploads/2026/03/Cloud-Migration-Checklist-Thumbnail.png)