
Last updated on July 14, 2022
How to Qualify the Value of Your Data and Analytics Initiatives
By Kevin Lobo
In this blog, we break down what it means to be a data-driven organization and how organizations traditionally measure success of their data and analytics initiatives. We explain why a different approach to qualifying the value of data initiatives is necessary, as well as key benchmarks to measure, and what you should do to get going in the right direction.
It’s a problem if you’ve invested time, money, and resources into becoming a data-driven organization, but you’re still spending too much time on manual processes, not able to access analytics quickly enough when they’re needed, or struggling to act on insights in ways that are meaningful and valuable to your organization. Realizing the value of your data and analytics initiatives should not be a new project. But how do you actually qualify what that value is, and what should you do to measure it in a tangible way? Before I answer those questions, let’s level set with what it means to be a data-driven organization, as well as some common mistakes we see organizations making when trying to measure success.What Does It Mean to Be a Data-Driven Organization?
According to a recent study conducted by the Harvard Business Review, “thriving as a mainstream company today means being data-driven.” But what does it mean to be data-driven, and why does it even matter? For most, the ability to effectively use data to make better informed decisions faster and consistently across all levels of the organization is a clear sign of being data-driven. In both the short and long term, this enables innovation, growth, sustainability, as well as the ability to provide a better employee and customer experience, driving competitiveness in several ways.A key to being data-driven is understanding that it needs to be part of the company culture, not just an IT department initiative.
What Are Common Mistakes of Measuring the Success of Data and Analytics Initiatives?
Although data and analytics are quantitative initiatives, they are often traditionally measured with qualitative metrics. Focusing on concepts and experience is an inexact way to measure something that has variables. Here are some common mistakes made in measuring the success of your data analytics initiatives:- Retrospective Analysis: Although there is tremendous value in knowing how far you have moved the needle from point A to point B, that alone can’t be a measurement of success. Many organizations make the common mistake of looking at where they were before the start of a data and analytics initiative—all our data sources were disparate—to where they are now—we implemented a cloud data warehouse that provides a single source of truth. While valuable, this kind of measurement is purely empirical. It does not tell you what processes have been automated, how much time it has saved your organization, or how the improved quality of your data has led to better insights across the organization.
- Gauge of Adoption: Although tracking how many people have adopted new technology is a sign of progress, that alone won’t give you the full picture of the value behind adoption. Many organizations make the mistake of looking at user adoption in a vacuum—we relied on Excel for reporting, and no one used it—to where they are now—we have a new business intelligence (BI) platform implemented, and everyone who needs a license has one and logs in. This kind of measurement does not tell you how that BI platform is being used or what value users are gaining from its implementation and bringing back to the business.
Learn to Empower Your Data Users by Building a Superior Data Experience
- Modern Data Swamp: The adoption of modern data platforms itself—we adopted a new data architecture—is often viewed as a barometer of success. However, without tying that adoption to performance optimizations and gains, it’s simply a celebration of new technology adoption. This kind of measurement glosses over the possibility that you may have simply inherited the systemic issues that plagued your legacy systems into any new platforms you have implemented.
It’s not that these approaches are bad—they’re just not tying action to your efforts, which is ultimately what you need to do to realize the full value of your data and analytics initiatives.But you’re not alone in this struggle. According to the survey conducted by Harvard Business Review, “In the 2021…Fortune 1000 companies reported a decline in the leading metrics, which are used for measuring the success of their data and AI investments. Companies reported struggling to make progress—and in many cases even losing ground—on managing data as a business asset, forging a data culture, competing on data and analytics, and using data to drive innovation.”
What’s a Better Way to Qualify the Value of Your Data and Analytics Initiatives?
Looking through a different lens will allow you to tie your data and analytics initiatives to the actual investment you made—whether it’s in technology, in people, in processes, or all three. Tying it to the investment—money, resources, time—will allow you to measure the success with quantitative metrics, ultimately providing a more complete understanding of the value you get out of your efforts and forging ahead with a data-driven culture across your organization. Here are some ways in which you can begin to qualify the value of your data and analytics initiatives: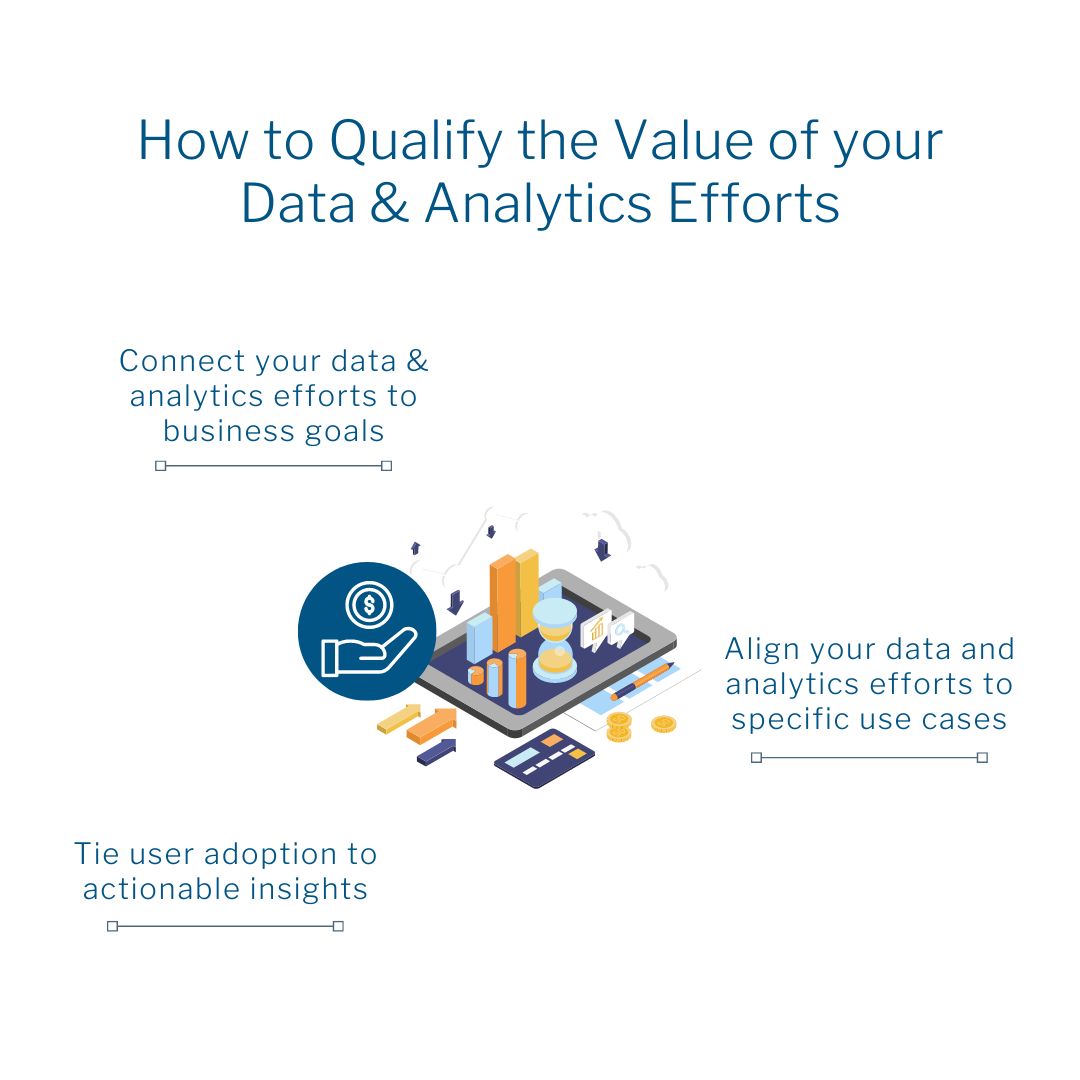
Ready To Unlock Data-Driven Decision Making?
Talk to an Expert About Your Data and Analytics NeedsConnect your data and analytics initiatives to a business goal
You have likely spent a lot of time on business strategy and creating business goals for the year. If you’re aligning your data and analytics initiatives to a business goal—i.e., introducing a new product or service in 6 months—include in that strategy what you need in order to be successful. Ask questions such as:- What data and analytics solution will I need to accomplish this goal? What are the costs—licensing, implementation, training, etc.—associated with the solution?
- How, specifically, will this solution help with the launch of the new product/service? What questions need to be answered by data, and do we have the data required?
- How will data and analytics lead to actionable insights for the product/service launch?
Learn more about “Why Now is the Time to Update Your Data Strategy—and How to Do It”
Align your data and analytics initiatives to specific use cases.
Implementing a new data or analytics technology—data warehouse, data transformation platform, BI platform, etc.—is a project. But it is an ongoing process to use the technology and to realize the value it can provide, not just in the short term, but long term as well. Start with identifying the first use case that initiated the data and analytics initiatives—marketing dashboard, sales forecasting, warehouse inventory, etc.—and ask questions such as:- Is your use case supporting specific business unit goals or an organization-wide initiative?
- What interdepartmental KPIs can be tied to organizational initiatives?
- What manual processes are you attempting to solve for with this initiative?
Tie user adoption to actionable insights.
It is great to see business users interacting with a new dashboard or adhering to data governance policies, but you need to look beyond that. The real value in user adoption lies in the action(s) that can be taken from that interaction. Beyond just how many people are using the technology—even using it well—ask questions such as:- How are success criteria defined? Specifically, measured as the number and volume of decisions that you’re enabling, or the quality of decisions being made because of your work.
- What is the hard ROI and dollar savings that you can plausibly tie to the volume and quality of those decisions?
- What financial levers (i.e., reducing supplier lead times or renegotiating vendor contracts) can you pull because of those quality decisions?
Setting Your Business Up for Successful Data and Analytics Initiatives
As you embark on any data or analytics initiative, remember that the goal is to effectively use data to make better informed decisions, faster and consistently across all levels of the organization. Keeping your focus on why is just as important as the how. Here are some tips to set your business up for a successful data and analytics project:- Start with the basics: Examine your data strategy to ensure it’s up to date, assess the capabilities of your data stack, and plan what it will take to get to your desired future state.
- Define success criteria: Remember that volume of dashboards or number of data sources isn’t what’s important here. The quality decision-making that your data analytics solutions enable should be the focal point of your effort.
- Tie to ROI and the financial bearing your solutions bring to bear: Quality decision making resulting from data analytics will invariably tie back to your bottom line. It’s critical to find the thread on how better decision-making can impact financial performance. Remember that proving ROI creates the easiest justification for future projects.
- Build with your users in mind: Build your solutions with the idea of centering your users and their experience with the solution itself at the top of your mind. Successful solutions are those that are built with a superior user experience driving the initiative.
Talk With a Data Analytics Expert
Key Takeaways
- Data-driven organizations leverage data to make informed decisions quickly and consistently across all levels, leading to innovation and growth.
- Common mistakes in measuring the success of data initiatives include relying solely on retrospective analysis, user adoption metrics, and modernization without performance gains.
- Success in data initiatives involves aligning them with business goals, specific use cases, and ensuring user adoption leads to actionable insights.
- Connect data initiatives to business objectives, understanding their role in supporting and enhancing organizational goals.
- Evaluating success should be based on the quality of decision-making enabled by data analytics, not just the quantity of dashboards or data sources.
- Effective user adoption is determined by the actionable decisions it facilitates, showing tangible returns on investment.
- Regular evaluation of data initiatives, approximately every six months, helps in assessing value and making required adjustments.
- Building solutions with user experience in mind ensures they are effective and widely adopted across the organization.