Data Strategy Consulting
Most data strategies fail in execution. We design for adoption from the start — aligning operating models, governance, and enablement to turn strategy into scalable business outcomes.
Data Strategy Services
Forget the roadmap decks that gather dust. We define how data and AI will drive measurable business value — and deliver actionable strategies shaped by real client outcomes.
AI Readiness
We help companies ready their data foundation for AI, including where to prioritize spend. Evaluate AI readiness, data maturity, and high-value use cases to define a practical roadmap that operationalizes AI with confidence.
Data Strategy Assessment
We’ll assess your current data and analytics issues and develop a complete data strategy, including a step-by-step roadmap to achieve long-term goals.
Technology Selection
We will help you choose the best tools for your needs, ensuring they play well with the rest of your data and analytics ecosystem and technologies.
Data Governance
Establish practical governance frameworks and management processes that make data secure, accessible, standardized, and trusted across your organization.
Data Team Talent Strategy
Design the organizational structure, operating model, and talent strategy required to scale data and AI with confidence.
Senior-led teams accountable for outcomes, not just recommendations.
We combine deep, real-world experience with targeted use of our proprietary, AI-powered RADAR framework to rapidly assess your data environment and AI readiness.
This technical insight is paired with stakeholder interviews, research, benchmarking, and scenario modeling to create a clear, actionable roadmap.
View our approach →
Your Stakeholder Interview Guide
Get the inputs you need to shape a strategy that solves business problems and inspires buy-in.
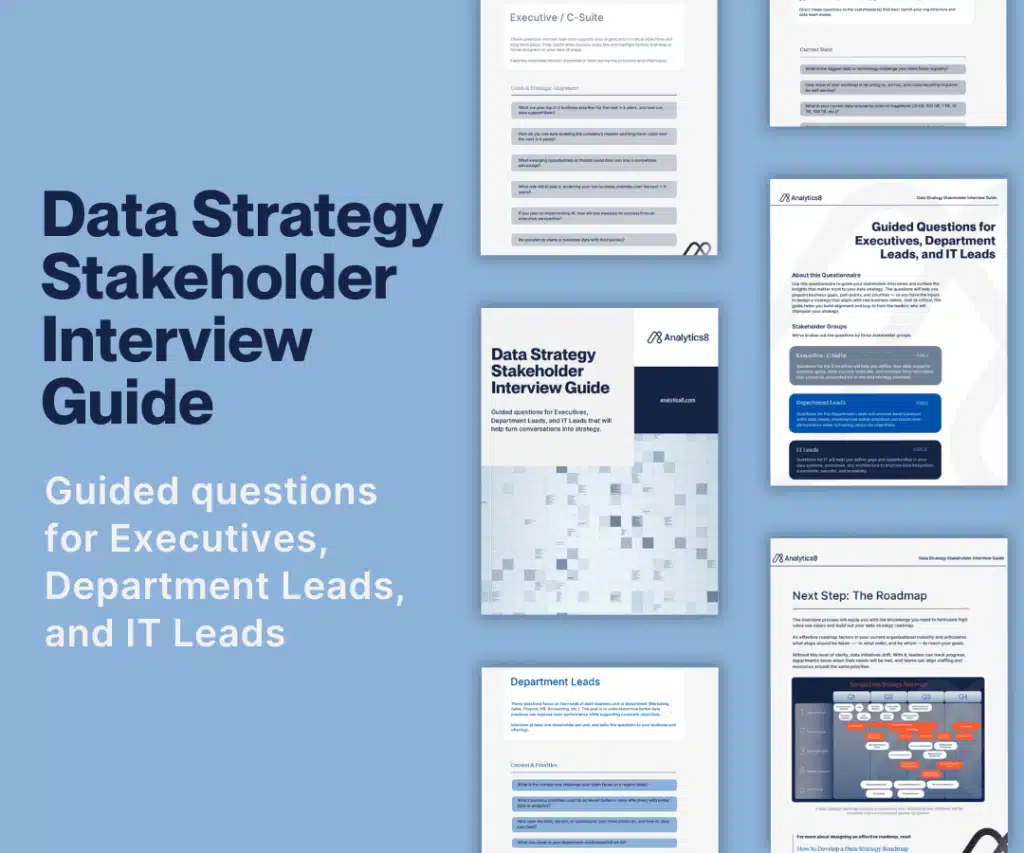
Our guided questions for Executives, Department Leads, and IT Leaders help you surface real business drivers, clarify decision-making needs, and define what’s required to deliver outcomes.
This dialogue will be the difference between a strategy that gets adopted and one that becomes expensive shelfware.
Strategy & Advisory Insights and Resources


Data leaders rest easy with a clear plan and guidance to get more value out of their data.

They really helped set the path forward. Our business is very fast-paced, and there are always curveballs or things that need to be handled right away. Throughout the whole process, Analytics8 was there every step of the way and adapted as needed.
Steven Khraiss, VP, Data Strategy & Analytics at Holmes Corp
Featured Customer Stories
With over 20 years of experience, we deliver end-to-end solutions that connect strategy through execution


Technology decisions have long-term business implications.
We bring deep expertise across leading data, analytics, and AI platforms — helping you choose and scale the right technologies to support your goals.