
Last updated on July 14, 2026
What Are the Four Types of Analytics and How Do You Use Them?
By Kevin Lobo
Analytics is a broad term covering four different pillars in the modern analytics model: descriptive, diagnostic, predictive, and prescriptive. Each type of analytics plays a role in how your business can better understand what your data reveals and how you can use those insights to drive business objectives. In this blog we will discuss what each type of analytics provides to a business, when to use it and why, and how they all play a critical role in your organization’s analytics maturity.
As organizations collect more data, understanding how to utilize it becomes paramount, driving the need for nuanced data analysis and interpretation. Data without analytics doesn’t make much sense, but analytics is a broad term that can mean a lot of different things depending on where you sit on the data analytics maturity model.
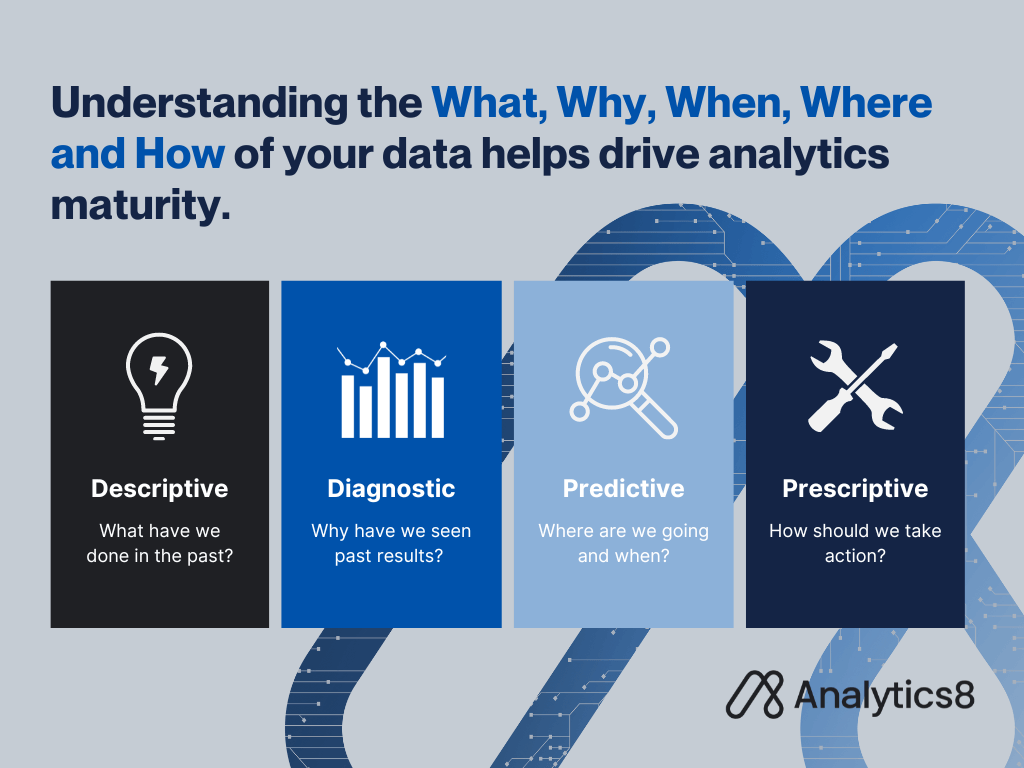
Modern analytics tends to fall into four distinct categories: descriptive, diagnostic, predictive, and prescriptive. How do you know which kind of analytics you should use, when you should use it, and why?
Understanding what, why, when, where, and how of your data analytics through data analysis helps to drive better decision making and enables your organization to meet its business objectives.
In this blog, we cover:
- What is Descriptive Analytics?↵
- What is Diagnostic Analytics?↵
- What is Predictive Analytics?↵
- What is Prescriptive Analytics?↵
- How to Leverage Generative AI to Get More Insights from Analytics?↵
Four Types of Analytics
Descriptive Analytics
What is Descriptive Analytics?
Descriptive analytics answer the question, “What happened?”. This type of analytics is by far the most commonly used by customers, providing reporting and analysis centered on past events. It helps companies understand things such as:
- How much did we sell as a company?
- What was our overall productivity?
- How many customers churned in the last quarter?
Descriptive analytics is used to understand the overall performance at an aggregate level and is by far the easiest place for a company to start, as data tends to be readily available to build reports and applications.
It’s extremely important to build core competencies first in descriptive analytics before attempting to advance upward in the data analytics maturity model. Core competencies include things such as:
- Data modeling fundamentals and the adoption of basic star schema best practices,
- Communicating data with the right visualizations, and
- Basic dashboard design skills.
How Do You Get Started with Descriptive Analytics?
It’s likely you’ve adopted some form of descriptive analytics internally, whether that be static P&L statements, PDF reports, or reporting within an analytics tool. For a true descriptive analytics program to be implemented, the concepts of repeatability and automation of tasks must be top of mind. Repeatability in that a data process is standardized and can be regularly applied with minimal effort (think a weekly sales report), and automation in that complex tasks (VLOOKUPS, merging of Excel spreadsheets, etc.) are automated, requiring little to no manual intervention. The most effective means to achieve this is to adopt a modern analytics tool that can help standardize and automate those processes on the back end and allow for a consistent reporting framework on the front end for end users.
Despite only being the first pillar of analytics, descriptive analytics also tends to be where most organizations stop in the analytics maturity model. While extremely useful in framing historical indicators and trends, descriptive analytics tend to lack a tangible call to action or inference on why something occurred, which leads us to the next pillar of analytics: diagnostic analytics.
Diagnostic Analytics
What is Diagnostic Analytics?
Diagnostic analytics, just like descriptive analytics, uses historical data to answer a question. But instead of focusing on “the what”, diagnostic analytics addresses the critical question of why an occurrence or anomaly occurred within your data. Diagnostic analytics also happens to be the most overlooked and skipped step within the analytics maturity model. Anecdotally, I see most customers attempting to go from “what happened” to “what will happen” without ever taking the time to address the “why did it happen” step. This type of analytics helps companies answer questions such as:
- Why did our company’s sales decrease in the previous quarter?
- Why are we seeing an increase in customer churn?
- Why are a specific basket of products vastly outperforming their prior year sales figures?
Diagnostic analytics tends to be more accessible and fit a wider range of use cases than machine learning/predictive analytics. You might even find that it solves some business problems you earmarked for predictive analytics use cases.
How Do You Get Started with Diagnostic Analytics?
Being at the diagnostic analytics phase likely means you’ve adopted a modern analytics tool. Most modern analytics tools contain a variety of search-based or lightweight artificial intelligence capabilities. These features allow for detailed insights a layer deeper (for example, the Key Drivers visualization in Power BI, or Qlik’s search-based insight functionality). To be clear, these are an effective, lightweight means to address diagnostic analytics use cases, but are not a means to a full-scale implementation. Software vendors like Sisu have built their core business around addressing diagnostic analytics use cases (what they call “augmented analytics”) and are a great bet.
Diagnostic analytics is an important step in the maturity model that unfortunately tends to get skipped or obscured. If you cannot infer why your sales decreased 20% in 2020, then jumping to predictive analytics and trying to answer “what will happen to sales in 2021” is a stretch in advancing upward in the analytics maturity model.
Predictive Analytics
What is Predictive Analytics?
Predictive analytics is a form of advanced analytics that determines what is likely to happen based on historical data using machine learning. Historical data that comprises the bulk of descriptive and diagnostic analytics is used as the basis of building predictive analytics models. Predictive analytics helps companies address use cases such as:
- Predicting maintenance issues and part breakdown in machines.
- Determining credit risk and identifying potential fraud.
- Predict and avoid customer churn by identifying signs of customer dissatisfaction.
How Do You Get Started with Predictive Analytics?
At the outset of any predictive analytics build, three core elements need to be established:
- Identify a problem to solve,
- Define what you want to predict, and
- State what you will achieve by doing so.
To start, you should collect existing data, organize data in a useful way to allow for data modeling, cleanse your data and review overall quality, and finally determine your modeling objective.
While modeling takes up the spotlight in predictive analytics, data prep is a crucial step that needs to happen first. This is why organizations with a rock-solid foundation in descriptive and diagnostic analytics are better equipped to handle predictive analytics. Simply put, the time and effort to prep, transform, and ensure data quality for retrospective reporting have already taken place. The groundwork should be relatively well laid to quickly identify and leverage data for the modeling phase. I always encourage customers with well-defined KPIs and business logic in a specific business reporting area (think sales reporting, for example) to use that as the first predictive analytics use case. The goal is to derive value quickly, and there is no better place to start than an area where you know data is well defined and of high quality.
Predictive analytics is the opening to the next step—prescriptive analytics.
Prescriptive Analytics
What is Prescriptive Analytics?
Prescriptive analytics is the fourth and final pillar of modern analytics. Prescriptive analytics pertains to true guided analytics where your analytics is prescribing or guiding you toward a specific action to take. It is effectively the merging of descriptive, diagnostic, and predictive analytics to drive decision making. Existing scenarios or conditions (think your current fleet of freight trains) and the ramifications of a decision or occurrence (parts breakdown on the freight trains) are applied to create a guided decision or action for the user to take (proactively buy more parts for preventative maintenance).
Prescriptive analytics requires strong competencies in descriptive, diagnostic, and predictive analytics, which is why it tends to be found in highly specialized industries (oil and gas, clinical healthcare, finance, and insurance, to name a few) where use cases are well defined. Prescriptive analytics help to address use cases such as:
- Automatic adjustment of product pricing based on anticipated customer demand and external factors.
- Flagging select employees for additional training based on incident reports in the field.
Prescriptive analytics’ primary aim is to take the educated guess or assessment out of data analytics and streamline the decision-making process.
How Do You Get Started with Prescriptive Analytics?
Prescriptive analytics is commonly considered the merging of descriptive, diagnostic, and predictive analytics. Getting started isn’t so much a step-by-step list but rather the time and effort up front to build your competencies within the analytics maturity curve.
Simply put, there is no starting point in prescriptive analytics without the requisite first three pillars of modern analytics being established first. If you’re ready for prescriptive analytics, then quantifying your call to action and the underlying criteria will be the first requirement. For example, if the use case is to call corrective action for an employee (i.e., additional training based on poor performance) then the factors that necessitate this action must be firmly established, and the action itself must be clearly defined.
Moving through the data analytics maturity model shouldn’t be a race. Knowing how each kind of analytics helps you better understand your data and how to use it to move your business objectives forward is key to realizing the return on investment in data and analytics.
Enhancing Analytics with Generative AI
While descriptive, diagnostic, predictive, and prescriptive analytics form the backbone of traditional data analysis and business decision-making, the introduction of generative AI represents a paradigm shift in how we interact with and leverage data. This evolution is not about replacing traditional analytics but enriching and optimizing them through innovative integration.
What is Generative AI?
Generative AI – a branch of artificial intelligence — employs machine learning models to create novel content or dataRather than simply analyzing existing information, it generates original, realistic outputs that enhance business problem-solving and decision-making capabilities. It enables greater automation, more personalized customer experiences, and a deeper level of creativity in extracting insights from data.
“Data visualization will become less relevant as people increasingly consume and interact with data via natural language, blurring the lines between operational and analytical systems even further.” – Analytics8 CTO, Patrick Vinton, on The Pros and Cons of Gen AI
How Do You Get Started with Generative AI?
Implementing generative AI in your organization involves understanding its unique capabilities and how they complement rather than replace your existing analytics framework. Leverage generative AI to get more insights from your descriptive, diagnostic, predictive, and prescriptive analytics, enhance overall decision-making, and drive innovation.
Here are some steps to get started:
- Align with Business Vision and Goals: Start by integrating generative AI with your overarching business objectives. It should build upon and complement the insights provided by traditional analytics methods.
- Evaluate Current Analytics Infrastructure: Assess how your current analytics capabilities can be augmented with generative AI. This involves identifying potential use cases where it can add significant value.
- Involve Stakeholders in Use Case Definition: Engage with key stakeholders to define meaningful applications of generative AI. Ensure these applications enhance decision-making processes and operational efficiency.
- Plan for Technology and Talent: Consider the technology infrastructure and the talent required to implement and sustain generative AI initiatives. This planning is crucial for a successful transition to more advanced, AI-driven analytics.
Learn more by diving into our 5 Pillars of an Effective Generative AI Strategy.
Talk With a Data Analytics Expert
Key Takeaways
- The four pillars of analytics—descriptive, diagnostic, predictive, and prescriptive—each answer a different question about your data and collectively move your organization up the analytics maturity curve.
- Descriptive analytics reveals what happened using historical data. It builds foundational reporting skills like data modeling, visualization, and automation.
- Diagnostic analytics explains why something happened. It adds depth to your analysis and helps uncover drivers behind key performance trends.
- Predictive analytics forecasts future outcomes using machine learning. It requires high-quality data and a clear understanding of what you’re trying to predict.
- Prescriptive analytics recommends specific actions based on all prior insights. It is best suited for mature organizations with well-defined use cases and strong analytical capabilities.
- Generative AI complements traditional analytics by enabling more intuitive, conversational data exploration. It enhances user access to insights without replacing core analytics pillars.
- To unlock value from analytics, organizations must move beyond static reports and adopt a maturity model mindset that builds capabilities in stages.