
Last updated on February 26, 2018
Demystifying Data Science – 5 Steps to Get Started
By David Fussichen
In this blog, we outline 5 major steps to a data science project while making the topic of data science more approachable and practical for your organization.
Everyone is talking about data science, machine learning, and augmented analytics these days. Organizations are trying to figure out if they need to invest in it, and if they are positioned to get started with it (the answer to both questions is probably “yes!”). But it can be an overwhelming topic with foreign vocabulary that only math PhDs understand. This does not have to be the case.
Step 1: Define Project Objectives
There’s no point in doing advanced analytics without a clear business objective. If you are in a decision-making position and hire a bunch of nerds (affectionately termed!), give them access to your data, and expect something magical to happen, you’re going to be disappointed. Those scientists need some specific problems to work on. Often, these problems are posed by senior-level people at a company and are related to enterprise-wide goals. For example:
>> Will my customer respond to a promotion? Will they switch to a competitor?
>> Will my patient need to be readmitted to the hospital?
>> If I make this financial trade, will I make money or not?
>> When is my machine going to fail so that I can plan ahead?
Step 2: Acquire and Explore Data
Once you’ve defined the project objectives and have a clear understanding of what questions need to be answered, the next step is to acquire and explore data (which many of us in the business intelligence industry are well-versed in). This starts with getting your data in a simple 2-dimensional table with rows and columns. The more historical data you have, the better your data model will likely be.
Identify Feature and Target Data
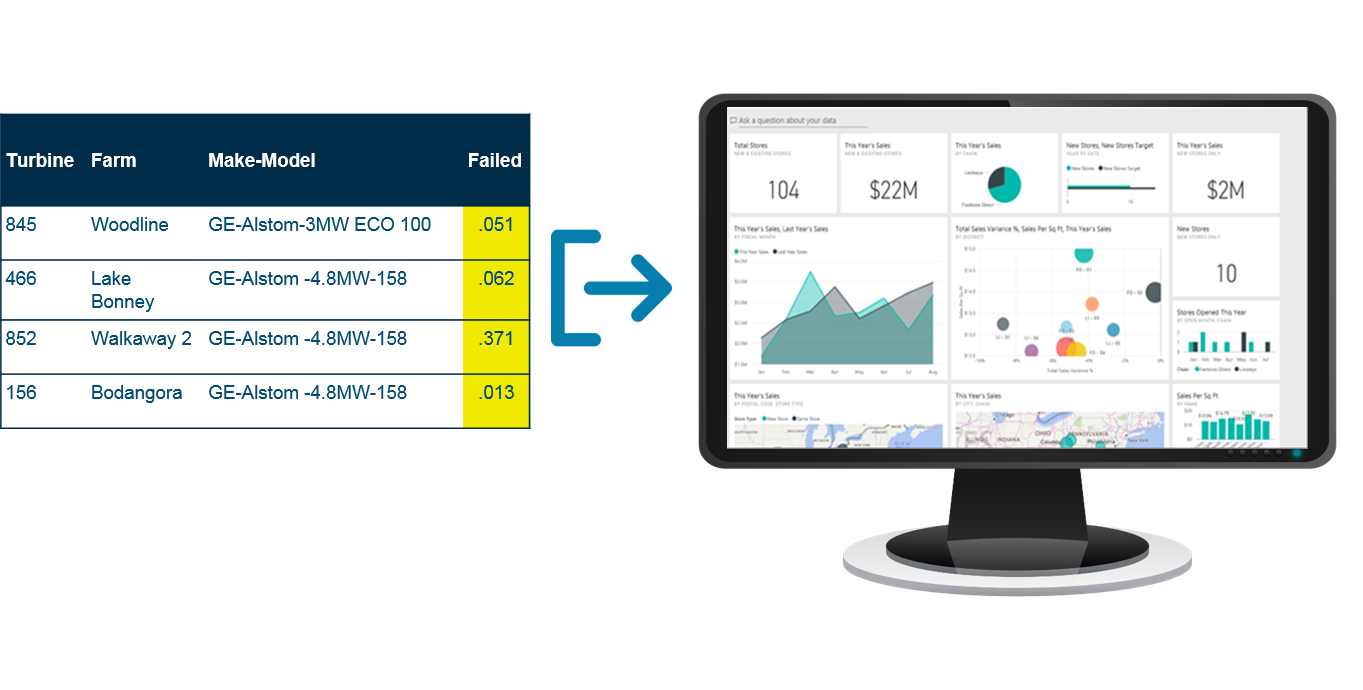
Then, you want to identify your Feature Data and your Target Data. In the world of data science, “Features” are attributes or dimensions that are potentially informative for what you are trying to predict. In this example, a wind turbine company is trying to predict how likely it is that their wind turbines will fail so that they can provide more timely preventative maintenance.
In this simplified sample data set, each row is an item (turbine) and each column is one Feature or attribute of the rows, including location, make-model, maintenance dates, operations data, and IoT data. The table below shows training or historical data where we know whether the turbine failed or not (within a particular timeframe).
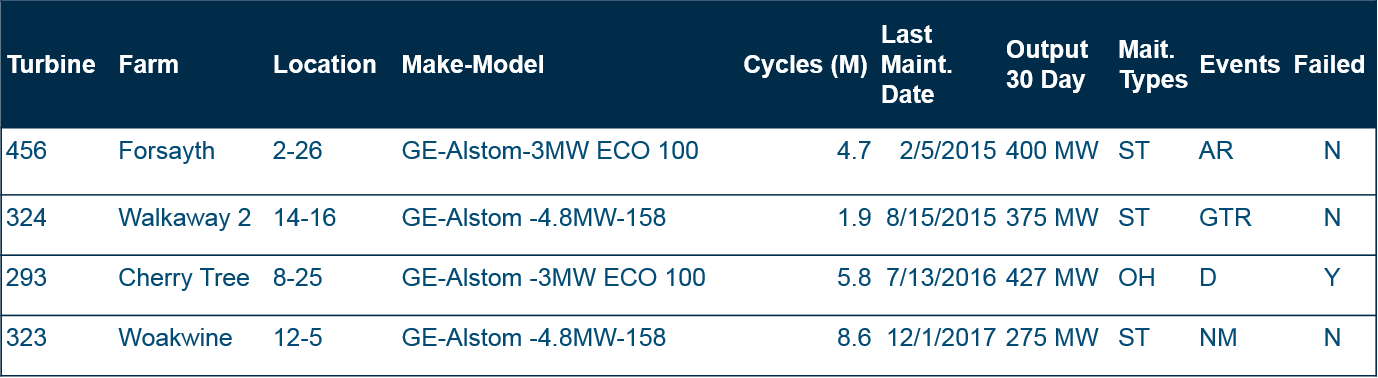
On the far-right column, we see the Target Data column – if the turbine failed.
Now, let’s take a look at a very similar data set – a prediction dataset – one where we don’t know if a turbine failed in our timeframe, because the time has not passed yet.
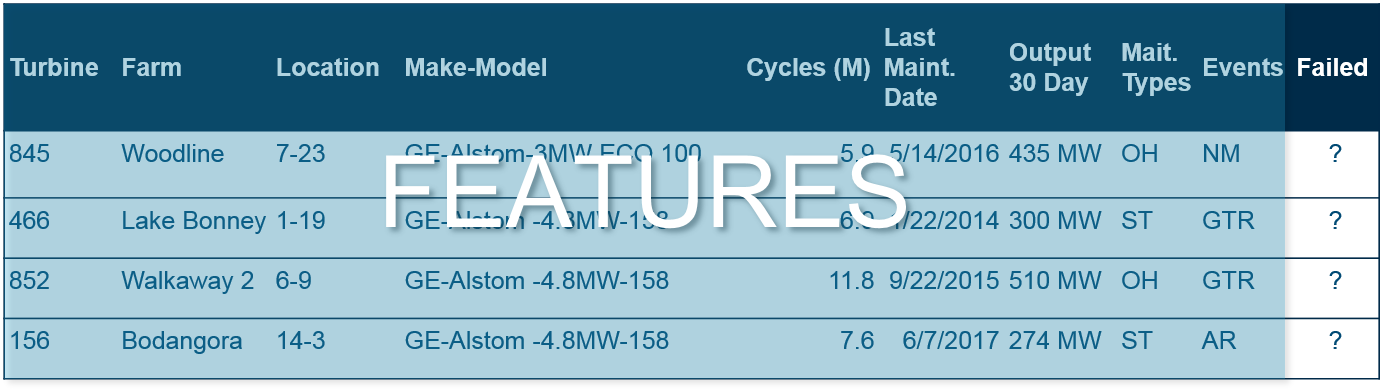
For our prediction data, the data in the “Failed” column is unknown.
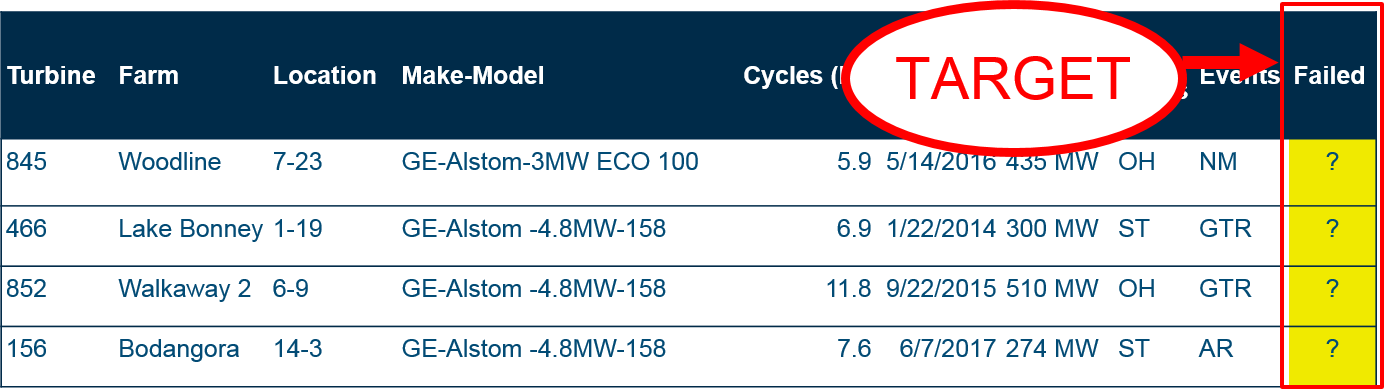
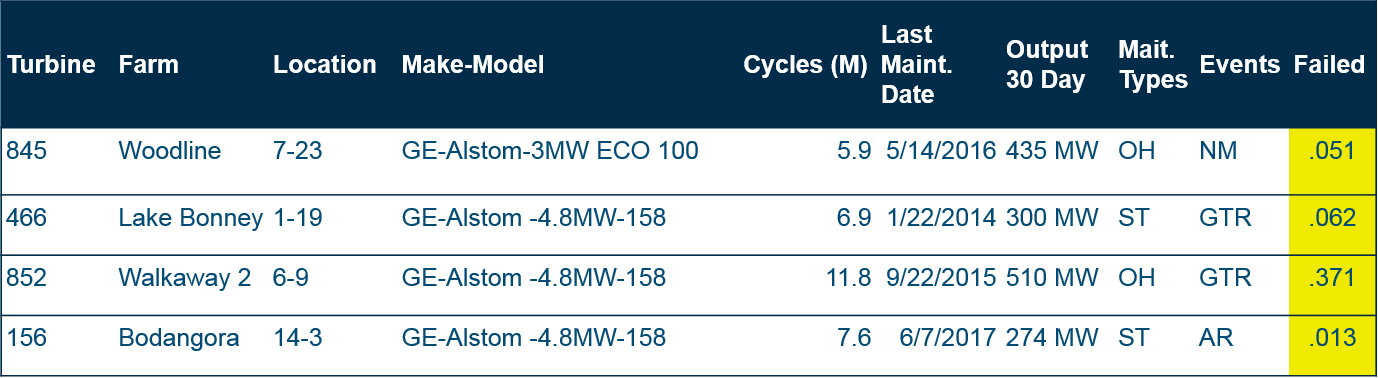
The point of building a machine learning model is to fill that unknown column of data with reliable predictions. After running the model, we can make informed decisions about turbine speed and preventative maintenance.
Step 3: Modeling
Now that we have our data together and know what problem we are trying to solve, we have to create a machine learning model to make predictions. The modeling process can be performed by highly trained data scientists in a programming language like R or Python; OR you can use software that can do a lot of the heavy lifting without having to learn some of the mechanics of machine learning modeling. Technologies such as DataRobot, RapidMiner, Amazon ML or SageMaker, Google ML or Prediction API, and Microsoft Azure ML Studio can help you quickly generate a model.
Perform Feature Engineering to Improve Your Model
No matter your approach to building your model, you’re always going to want to improve it for more precise predictions. However, tweaking models is likely to result in only modest gains. Sometimes small gains make a big difference – like in a day trading system – but in most cases, small incremental improvements aren’t worth the effort.
A practice that helps make your model more predictive is Feature Engineering. Feature engineering is when you create or add new features (columns of data) to your existing model. Derive features from your existing features or go find some extra data (which software can certainly help with). Think hard about what additional data you can add and where it comes from. It can be internal corporate data or external data, like geospatial and demographic data, public datasets, and trade group and association data offerings. The more feature data your model has, the more it can learn and predict.
Step 4: Interpret and Communicate
Once you have a model, it is critical that you understand what it is doing. You need to understand how often your model will give “false positives” or “true negatives,” or how your model performs at the extremes. Time spent learning how to evaluate and interpret models is time well spent.
Typically, data science projects are communicated with a PowerPoint presentation by a data scientist to senior business people. The presentation is oftentimes highly technical (and it needs to be to communicate what it is doing), but executives may not have the background or time to really understand. What happens is that a data scientist is essentially asking executives to “just trust me.”
Use your Business Intelligence Tools to Help Tell the Story
One strategy to better communicate the results of a model is to prototype your results in a data visualization tool and show how it works rather than just explaining it. When you feed your results into a tool business people are comfortable with, you can place focus on the business value. A data visualization tool helps you tell a story that may be hidden in your presentation of log loss ratios, lift charts, or confusion matrices. This also gives you a head start on implementation.
Step 5: Implement
The last step of a data science project is to implement your machine learning model. Implementation takes many forms depending on the business purpose.
You may want to make a one-time decision or a batch of decisions. For example, you run the model one time, and then you know that 30 of your machines need to be serviced. The data science project is then complete, and you may run it sometime in the future.
Or, you can integrate the model into an application to automate decision-making. For example, a doctor who is treating a patient could have an application on their iPad that uses a machine learning model to predict the likelihood of patient protocol compliance and readmission.

Other examples of business users who could utilize an application that integrates machine learning models include:
>> Day traders making buy/sell decisions
>> Supply chain professionals are making purchasing decisions
>> Retailers making pricing decisions
>> Marketers designing promotional programs
>> Machine operators deciding when to replace parts
Whether or not you are making one-time or ongoing decisions based on your machine learning model, we recommend integrating your model into your traditional data visualization tools. This is the most helpful step an organization can take to make the most of their investment in data science.
To learn more about data science, check out our webinar.