
Last updated on July 15, 2026
How to Make Self-Service Analytics Work: Tips to Overcome Common Issues with “Self-Service”
By Pat Ross
You rolled out self-service analytics tools so teams could move faster and make decisions without waiting on IT. But instead of clarity, you’re getting conflicting numbers, misinterpreted insights, and dashboards no one trusts. Sound familiar? This blog breaks down where self-service typically falls apart, what you need to do differently, and what success looks like inside a well-supported, data-literate organization.
When self-service fails, it doesn’t just waste time — it leads to bad decisions, eroded trust, and slower execution. But when it works, it speeds up problem-solving, aligns teams, and drives better outcomes across the business.
- What “good” self-service analytics delivers↵
- Where self-services analytics fall short↵
- How to fix self-service analytics ↵
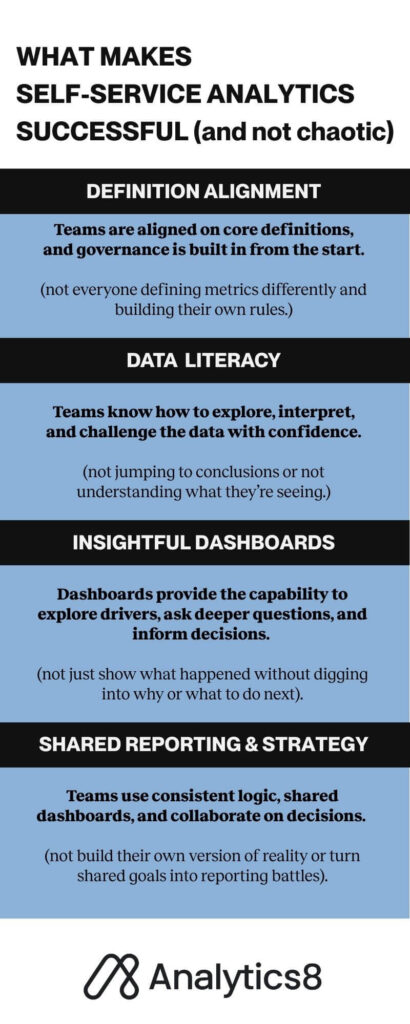
What “Good” Self-Service Analytics Delivers
Success isn’t about dashboards running smoothly — it’s about changing how your teams operate. When done right, self-service analytics transforms the way people ask questions, share insights, and make decisions.
Here’s what that looks like in practice:
Teams Feel Empowered — And It Shows
When users don’t have to wait on IT for answers, they move faster — and more confidently. But that only happens when you give them more than access. You give them the tools, training, and trust to explore on their own.
- Users build reports, interpret results, and take action without needing a data translator.
- Business teams understand the metrics that matter most in their domain and use them to track performance, identify gaps, and course-correct in real time.
- A culture of data literacy takes hold—where asking better questions and sharing insights is the norm, not the exception.
You’ll know it’s working when a frontline manager spots a trend before it becomes a problem—and doesn’t have to open a ticket to act on it.
Reports Are Consistent and Trusted
Good self-service doesn’t mean everyone builds their own version of the truth. It means everyone works from the same truth — and applies it to their context.
- Teams use standardized metric definitions, so there’s no confusion over what “churn” or “revenue” means.
- Reports reflect clean, validated data — so users don’t waste time second-guessing the numbers.
- Built-in data quality checks and validation rules quietly keep everything running in the background.
When people stop arguing over whose dashboard is right, and start aligning around what to do next — you’ve nailed it.
Decisions Get Smarter, Faster
Self-service only matters if it leads to better outcomes. That means decisions based on real-time insight, not outdated reports or gut instinct.
- KPIs are accessible, easy to understand, and updated frequently — so teams stay aligned and agile.
- Users drill into trends, explore variables, and connect dots they couldn’t see before.
- Business questions turn into data-driven strategies — quickly, confidently, and without bottlenecks.
You’ll see this play out in tighter feedback loops, smarter bets, and fewer “we didn’t see this coming” moments.
Teams Collaborate Instead of Compete
Great self-service analytics breaks down silos. It gets everyone working from the same data, toward the same goals.
- Cross-functional teams (like sales and marketing, or product and support) work from shared dashboards and speak the same data language.
- KPIs reflect company-wide priorities, not just department-level metrics.
- Insights are shared across teams — not hoarded — leading to more collaborative decisions and fewer blind spots.
When teams start challenging each other’s interpretations in the best way possible — not to win an argument, but to get to the right answer — you’re no longer just “doing analytics.” You’re building a data-driven organization.
Where Self-Service Analytics Fall Short
You invest in self-service tools so your teams can move faster, ask their own questions, and skip the back-and-forth with IT. But instead of clarity, you end up with data chaos, shallow reports, and decisions no one can fully explain. The problem isn’t access — it’s what happens when access comes without structure.
Here are four common reasons self-service analytics may be causing more harm than good:
1. You lack central structure and oversight
When there’s no central structure or oversight, self-service turns into a free-for-all, and there are inconsistencies everywhere. Everyone defines metrics differently, pulls from different sources, and builds their own rules — which leads to confusion and mistrust.
- Competing reports show different numbers for the same metric, and no one’s sure which one to trust.
- Data security slips when sensitive fields are exposed to the wrong users or pulled into spreadsheets with no oversight.
- Flawed logic — like incorrect aggregations or missing filters — goes unnoticed until someone’s already acted on it.
You’ll spot this when teams spend more time defending their numbers than discussing what to do next.
2. Business users lack the training to interpret data correctly
Self-service puts data in more hands — but that doesn’t mean users know what to do with it. Without analytical training, even well-meaning users can misread the data and make calls that don’t hold up.
- They mistake correlation for causation and draw conclusions that don’t hold up under scrutiny.
- They rely on intuition over sound logic and miss red flags in the data.
- They don’t always understand how the data was generated, which leads to misreading what it actually means.
This doesn’t mean users can’t or shouldn’t explore data — but it does mean they need context and guardrails.
3. You miss what’s driving the numbers
Quick dashboards might answer “what happened,” but they rarely explain why. And when users don’t understand the story behind the data — how it was generated, what’s missing, or what’s influencing the trends — they can’t make confident decisions. They react to surface-level metrics instead of real insight.
- Users stop at top-line KPIs without digging into what’s driving the change.
- They treat metrics in isolation, missing critical inputs that would’ve shifted the entire takeaway.
- Reports get built to support a gut feeling — not to challenge it.
- They jump to action without asking, “Is this trend meaningful — or just noise?”
- They don’t see their business reflected in the data model — because it’s not aligned with the terms, processes, or goals they use every day.
You’ll know this is happening when reports look identical across teams, no one’s pushing for deeper answers, and decisions unravel under scrutiny.
4. Inconsistent practices between departments and teams
Even with good intentions, teams often go it alone — building their own reports, metrics, and logic. Without coordination, that independence turns into fragmentation and redundant work.
- Different departments define metrics differently, so cross-team reporting becomes a mess.
- Teams build duplicate dashboards for similar needs, wasting effort and creating confusion.
- Shared goals turn into debates about whose numbers are right.
If you’re seeing multiple dashboards for the same topic with no agreement, this is likely the cause.
The Bottom Line: Self-service analytics isn’t a shortcut to better decisions. It only works when it’s built on structure, shared definitions, and a culture of analytical thinking. Without that, you’re not empowering users — you’re just letting them fly blind with expensive tools.
Steps for Success: How to Fix Self-Service Analytics
You don’t fix broken self-service analytics by adding more tools. You need the right structure in place, your users need support, and you must constantly revisit and refine how your teams access and interact with data.
Here’s how to make it work in practice:
1. Establish Governance Early and Revisit Often
If everyone defines metrics differently, you don’t have self-service — you have self-serve chaos. To build trust in your data, you need good data governance foundations.
- Standardize key metrics like churn, revenue, or active users so everyone speaks the same language.
- Implement role-based access controls to ensure users only see what they need — and nothing more.
- Maintain data quality through regular audits and automated checks.
Pro tip: Don’t treat governance like a one-time setup. The moment your business evolves, your definitions, permissions, and processes need to evolve too. Build in regular checkpoints — otherwise, you’re one reorg or product launch away from backwards reporting.
2. Build Data Literacy into Your Culture
Giving access without education sets users up to fail. If your teams can’t confidently explore and interpret data, you won’t get value from your tools — just more questions.
- Train teams to explore data thoughtfully — how to ask the right questions, identify trends, and spot common errors.
- Offer short, practical sessions that demystify dashboards and show users how to avoid common traps (like mistaking correlation for causation).
- Provide real-time support through help desks, office hours, or chat channels where users can get unstuck quickly.
- Foster internal communities that share tips, compare reporting strategies, and surface questions others might not think to ask.
Pro tip: One-and-done training won’t work. A single dashboard workshop won’t make your team data fluent. Instead, create lightweight, ongoing learning moments — like monthly “what went wrong” reviews or live walkthroughs of real reports. People learn best when it’s tied to their actual work.
3. Take Advantage of New AI-Driven Self-Service Features
Traditional self-service analytics often stalls in the “last mile” — users get access to data, but still rely on exports, ad-hoc queries, or slow back-and-forth with data teams to get real answers. That’s where Agentic AI can change things.
With Agentic AI capabililites, your business users don’t just explore dashboards — they can engage in natural and intelligent conversations with their data.
- Ask open-ended questions like “Why did revenue drop last quarter?” and get real-time answers — no SQL required.
- Follow-up questions are built-in, helping users dig deeper and uncover what’s driving the numbers — not just what changed.
- Agentic AI understands your organization’s unique terminology and business logic — bridging the gap between technical models and how teams actually work.
Pro tip: If your team still exports data to Excel “just to double-check,” your tools are falling short. Agentic AI lets users ask questions in their own words and get answers they can trust — and act on — immediately.
The result? Faster decisions, fewer tickets, and a true leap forward in self-serve — because it’s not just about access anymore. It’s about understanding.
4. Balance Autonomy with Oversight
Self-service doesn’t mean hands-off. Your users should be able to explore data independently, but IT still plays a critical role in support, quality control, and tool maintenance.
- Let teams create their own reports but have IT or data leads validate high-impact dashboards before they’re shared broadly.
- Look for patterns in ad-hoc requests. If three teams are asking for the same analysis, build it once and standardize it.
- Keep IT engaged in tool management, data pipeline health, and ensuring proper usage of the platform.
Pro tip: The sweet spot isn’t total freedom or tight control — it’s guided autonomy. Keep data teams in the loop to spot red flags, validate logic, and streamline repeat requests before they become reporting headaches.
5. Design Dashboards Around Roles, Not Just Data
The best dashboards aren’t overloaded — they’re focused. When you design with users in mind, you get faster adoption and better insights.
- Build role-based dashboards that surface the most important information for each team — marketing, finance, sales, ops.
- Keep the underlying metric definitions consistent, even if the way they’re visualized varies by team.
- Use filters and drill-downs so users can explore further without getting overwhelmed up front.
Pro tip: Don’t just ask what data a team needs — ask how they’ll actually use it. Role-based dashboards should help users do their jobs better, not just look pretty. Start with their questions, then build from there.
6. Monitor Usage and Evolve Your Approach
Even the best-designed self-service environment needs maintenance. Usage shifts. Business needs change. You must pay attention.
- Track which dashboards get used — and which ones don’t.
- Review how teams are making decisions. Are they using insights to take action, or just checking a box?
- Gather regular feedback on what’s working, what’s unclear, and what’s missing.
- Use those inputs to refine training, streamline reporting, and revisit governance as needed.
Pro tip: Dashboard usage is a feedback loop. If reports sit untouched or spark more confusion than clarity, treat that as a signal — not a failure. Use it to fine-tune what you build, how you train, and where your data strategy needs to evolve.
Remember: Self-service analytics works when it’s supported. That means good data governance, consistent training, and a balance of freedom and oversight. When your teams understand the data, trust the numbers, and have the right support, they stop guessing — and start making smarter, faster decisions.
Not sure where to begin? Start by asking a few foundational questions:
- Are your teams aligned on how core metrics are defined?
- Do users feel confident interpreting and acting on data?
- Are dashboards being used to drive decisions — or just sitting untouched?
If the answers surprise you, that’s a good thing. It means you’ve found the gaps — and now you know where to focus. Fixing self-service analytics isn’t about perfection. It’s about progress, clarity, and creating a system your teams can actually rely on.
Talk With a Data Analytics Expert
Key Takeaways
- Self-service only works when built on structure, trust, and shared definitions. Without governance, oversight, and alignment on core metrics, access alone creates confusion, not clarity.
- A strong culture of data literacy transforms how teams work. Empowering users through ongoing training and support helps shift analytics from dependency to confident, independent decision-making.
- Consistency and clean data build trust; fragmentation destroys it. Standardized metrics, validated sources, and integrated practices prevent reporting chaos and conflicting insights.
- Analytical thinking needs to be taught, not assumed. Even well-meaning users can misinterpret data without the context, guidance, and guardrails that support critical thinking.
- AI-powered self-service bridges the gap between access and understanding. Agentic AI tools enable users to explore data conversationally, follow up intelligently, and get to meaningful answers faster.
- Balance autonomy with responsible oversight. Let teams explore and create, but ensure IT and data leaders guide high-impact outputs and system integrity.
- Role-based dashboard design improves adoption and usability. Tailoring analytics to user needs, while maintaining shared definitions underneath, keeps data actionable and relevant.
- Self-service is never “set it and forget it.” Success requires continuous feedback, usage monitoring, and iteration to adapt to changing business needs and evolving team behaviors.